CTSA - Clear Trend and Swing Alert by Tony-TechCTSA – Clear Trend & Swing Alert
CTSA (Clear Trend & Swing Alert) is a precision market-structure indicator designed for traders who want high-quality swing, trend, and continuation signals across Forex, Crypto, Indices, and Commodities.
The indicator automatically analyzes swing points, trend direction, momentum, volatility, volume, and EMA structure to generate optimized BUY and SELL alerts. It adapts to different asset classes and trading styles through an intelligent Preset Engine, providing ideal settings for Intraday, Swing, or Position trading.
CTSA identifies:
Trend Continuation Signals
Trend Pullback Entries
Reversal Opportunities
HH/HL/LH/LL Swing Structures
Smart Exits using Opposite Signals or Trend Flip
The dashboard provides an at-a-glance view of market conditions including trend status, swing type, RSI, ADX, volume strength, EMA bias, and ADR levels.
CTSA is built for traders who want clean, actionable alerts, strong confluence, and a simplified decision-making workflow—whether scalping M15 or swing-trading H1/H4.
Cari dalam skrip untuk "swing trading"

🎓 Smart Beginner Pro - AI Trading Assistant🎓 Smart Beginner Pro - AI Trading Assistant
Short Description:
Your perfect FIRST trading indicator! Clear BUY/SELL signals with automatic risk management. Learn professional trading while getting 5-star rated entries. Built-in education + Stop Loss/Take Profit included. No experience needed!
🎯 FULL DESCRIPTION
Smart Beginner Pro is the ONLY indicator designed specifically to help complete beginners start trading professionally from day one!
Unlike complicated indicators that overwhelm you with information, Smart Beginner Pro makes trading simple while teaching you professional techniques.
🌟 What Makes This Special?
⭐ 5-Star Quality Rating System
Every signal is rated 1-5 stars based on:
✅ Trend alignment
✅ Major trend confirmation
✅ Volume analysis
✅ RSI health check
✅ Trend strength
You always know EXACTLY how good a setup is before entering!
Example:
⭐⭐⭐⭐⭐ = Perfect setup (all factors aligned)
⭐⭐⭐⭐ = Excellent setup (4/5 factors)
⭐⭐⭐ = Good setup (3/5 factors)
Choose your preferred quality level - Conservative traders only take 5-star signals!
🎓 Built-in Education
Learn WHILE You Trade!
This isn't just an indicator - it's your AI trading teacher!
Beginner Mode Features:
✅ Educational tooltips on every signal
✅ Explains WHY each signal appears
✅ Shows what each factor means
✅ Teaches you professional analysis
✅ Risk management guidance included
After a few weeks, you'll understand:
How trends work
Why volume matters
When to enter trades
How to manage risk
Professional trading concepts
Turn OFF Beginner Mode when ready for cleaner charts!
🛡️ Automatic Risk Management
Never Wonder Where to Place Stops Again!
Every signal comes with:
Entry Zone (Green box)
Exact entry price shown
Small buffer zone for entry
Stop Loss (Red box)
Calculated using ATR (volatility)
Placed at safe distance
Protects your capital
Take Profit 1 (Yellow box)
First profit target (50% of full target)
Partial profit recommended
Take Profit 2 (Green box)
Full profit target (1:3 risk/reward default)
Let winners run!
Risk/Reward Ratio: Always displayed!
Default: 1:3 (Risk $10 to make $30)
Customizable: 1.5 to 5.0
Professional money management built-in
🎯 Crystal Clear Signals
No Confusion. No Guessing.
BUY Signals:
🟢 HUGE green arrow below bar
Text says "BUY"
Star rating above
Can't miss it!
SELL Signals:
🔴 HUGE red arrow above bar
Text says "SELL"
Star rating below
Impossible to miss!
WAIT (No Signal):
⚪ Dashboard shows "WAIT"
Don't trade when no signal
Patience is key!
📊 Live Dashboard
All Information at a Glance:
Everything you need to make a decision - RIGHT THERE!
⚙️ Three Sensitivity Modes
Choose your trading style:
🎯 Conservative (Recommended for Beginners)
✅ Only 5-star signals
✅ 2-3 signals per day
✅ Highest win rate
✅ Best for learning
✅ Perfect for part-time traders
⚖️ Balanced (Default)
✅ 4-5 star signals
✅ 5-8 signals per day
✅ Good win rate
✅ More opportunities
✅ Best for most traders
⚡ Aggressive (For Active Traders)
✅ 3-5 star signals
✅ 10-15 signals per day
✅ More trades
✅ Requires experience
✅ For full-time traders
Start Conservative → Move to Balanced → Then Aggressive as you improve!
🌍 Works on EVERYTHING
✅ All Markets:
Forex (EUR/USD, GBP/USD, etc.)
Crypto (Bitcoin, Ethereum, etc.)
Stocks (Apple, Tesla, etc.)
Indices (S&P 500, NASDAQ, etc.)
Commodities (Gold, Silver, Oil, etc.)
✅ All Timeframes:
M5-M15: Scalping (quick trades)
M15-H1: Day trading (same day)
H4-D1: Swing trading (multi-day)
One indicator for your entire trading career!
🕐 Session Highlighting
Trade at the Right Time!
Background colors show best trading sessions:
🟢 Green = London Session (8 AM - 4 PM GMT)
High liquidity
Best for EUR/GBP pairs
🔵 Blue = New York Session (1 PM - 9 PM GMT)
Maximum liquidity
Best for all USD pairs
No color = Asian Session
Lower liquidity
Beginners: Avoid or trade carefully
Toggle ON/OFF in settings if you don't need it.
📚 How to Use (Step by Step)
For Complete Beginners:
Step 1: Add to Chart
1. Open your favorite pair (Start with EUR/USD)
2. Set timeframe to M15
3. Add "Smart Beginner Pro" indicator
4. Done! Default settings work great!
Step 2: Wait for Signal
1. Watch the dashboard
2. When it says "BUY" or "SELL" → A signal appeared!
3. Check the star rating (aim for 4-5 stars)
4. Look at "Safe to Trade" (should be ✅ YES)
Step 3: Enter Trade
1. Enter at current market price
2. Set Stop Loss at RED box level
3. Set Take Profit at GREEN box level (TP2)
4. Optional: Take partial profit at YELLOW box (TP1)
Step 4: Manage Trade
1. Let the trade run to TP or SL
2. Don't move stops (trust the system)
3. When TP1 hit: Close 50%, let rest run
4. When TP2 hit or SL hit: Close completely
Step 5: Learn & Improve
1. Review what happened
2. Was it a 5-star? How did it perform?
3. Read the tooltips (Beginner Mode)
4. Understand WHY signals work
5. Get better with each trade!
💡 Trading Rules for Success
🟢 DO:
✅ Only trade 4-5 star signals at first
✅ Use proper position sizing (1-2% risk)
✅ Always set Stop Loss (use indicator levels)
✅ Be patient (wait for quality setups)
✅ Trade during good sessions (London/NY)
✅ Learn from each trade
✅ Keep a trading journal
🔴 DON'T:
❌ Trade 1-2 star signals (not shown anyway)
❌ Risk more than 2% per trade
❌ Move stop losses (honor them!)
❌ Trade without a signal
❌ Overtrade (quality > quantity)
❌ Trade when "Safe to Trade" says NO
❌ Trade on emotion
⚙️ Settings Explained
📊 Mode Settings
Beginner Mode (Default: ON)
What it does:
- Shows educational tooltips
- Displays "Why?" explanations
- Extra help text
- Star ratings always visible
Turn OFF when:
- You understand the signals
- Want cleaner charts
- Prefer minimal interface
Signal Sensitivity
Conservative: Only perfect setups (5 stars)
Balanced: Good setups (4-5 stars)
Aggressive: Okay setups (3-5 stars)
Tip: Start Conservative, upgrade as you improve!
📈 Trend Settings
Fast EMA (Default: 9)
Shorter period = More responsive
Longer period = Smoother trend
Recommended: Keep at 9
Slow EMA (Default: 21)
Used with Fast EMA for crossovers
Recommended: Keep at 21
Standard setting works best
Major Trend EMA (Default: 200)
The "big picture" trend
Above = Uptrend | Below = Downtrend
Never trade against this!
Recommended: Keep at 200
Show EMAs (Default: ON)
Toggle if you want cleaner chart
EMAs still calculated even if hidden
Dashboard still shows trend direction
🛡️ Risk Management
Risk/Reward Ratio (Default: 3.0)
How much profit vs risk
3.0 = Risk $10 to make $30
Conservative: 2.0
Balanced: 3.0
Aggressive: 4.0-5.0
Higher = Bigger targets (but fewer hits)
Stop Loss ATR Multiplier (Default: 1.5)
How far stop loss is placed
Based on volatility (ATR)
Tight: 1.0 (more stops hit)
Balanced: 1.5
Loose: 2.0-3.0 (fewer stops, bigger risk)
Show Entry/SL/TP Boxes (Default: ON)
Toggle the colored risk boxes
Keep ON for visual guidance
Turn OFF for minimal charts
🎨 Visual Settings
Highlight Trading Sessions (Default: ON)
Shows London/NY sessions with color
Helps you trade at best times
Turn OFF if you trade 24/7
Show Trend Strength Bar (Default: ON)
Shows trend strength percentage
Useful for filtering weak trends
Turn OFF if not needed
🎓 Educational Value
What You'll Learn:
Week 1-2: Basics
✅ How to read trend direction
✅ When to enter trades
✅ Where to place stop losses
✅ What risk/reward means
✅ Why some signals are better than others
Week 3-4: Intermediate
✅ How EMA crossovers work
✅ Why volume matters
✅ What RSI tells you
✅ Session timing importance
✅ Risk management principles
Month 2-3: Advanced
✅ Market structure understanding
✅ Trend vs range recognition
✅ Quality signal identification
✅ Position sizing strategies
✅ Trading psychology basics
After 3 Months:
🎯 You're no longer a beginner!
🎯 You understand price action
🎯 You can analyze markets yourself
🎯 You make informed decisions
🎯 Ready for advanced indicators
💎 Why Choose Smart Beginner Pro?
vs. Other Beginner Indicators:
Most Beginner Indicators:
❌ Just show arrows (no explanation)
❌ No quality rating
❌ No stop loss help
❌ No education
❌ Too many bad signals
❌ Confusing settings
Smart Beginner Pro:
✅ Explains WHY each signal
✅ 5-star quality system
✅ Automatic SL/TP levels
✅ Built-in education
✅ Quality over quantity
✅ Simple, clear settings
✅ Professional results from day 1
vs. Advanced Indicators:
Advanced Indicators:
❌ Too complicated for beginners
❌ Require trading knowledge
❌ No educational features
❌ Overwhelming settings
❌ Steep learning curve
Smart Beginner Pro:
✅ Simple but powerful
✅ No prior knowledge needed
✅ Teaches while you trade
✅ Easy to understand
✅ Grows with you
🚀 Quick Start Guide
First 24 Hours:
Hour 1: Setup
1. Add indicator to EUR/USD M15
2. Enable all alerts (BUY + SELL)
3. Read dashboard labels
4. Wait for first signal
Hour 2-24: Learn
1. Watch how signals appear
2. Check star ratings
3. Observe trend direction
4. Notice session highlights
5. Don't trade yet - just observe!
Day 2-7: Demo Trading
1. Open demo account
2. Trade ONLY 5-star signals
3. Use exact SL/TP from indicator
4. Risk $100 per trade (demo)
5. Keep journal of results
6. Review each trade (win or loss)
Week 2+: Real Trading
1. Start with SMALL real account ($100-500)
2. Risk only 1% per trade ($1-5)
3. Trade Conservative mode only
4. Build confidence slowly
5. Increase size as you improve
🔔 Alert System
Available Alerts:
1. BUY Signal
Triggers: When 4-5 star BUY appears
Message: "SMART BEGINNER PRO - BUY SIGNAL!"
Action: Check chart, enter if conditions met
2. SELL Signal
Triggers: When 4-5 star SELL appears
Message: "SMART BEGINNER PRO - SELL SIGNAL!"
Action: Check chart, enter if conditions met
3. 5-STAR BUY (Premium Quality)
Triggers: Only perfect 5-star BUY setups
Message: "PERFECT 5-STAR BUY SIGNAL!"
Action: Highest probability - don't miss!
4. 5-STAR SELL (Premium Quality)
Triggers: Only perfect 5-star SELL setups
Message: "PERFECT 5-STAR SELL SIGNAL!"
Action: Highest probability - don't miss!
Alert Setup:
1. Click "Create Alert" on indicator
2. Choose "BUY Signal" and "SELL Signal"
3. Set "Once Per Bar Close"
4. Enable notifications to phone/email
5. Never miss a quality setup!
📊 Best Practices
Daily Routine:
Before Market Open:
1. Check economic calendar
2. Identify trending pairs
3. Set up charts with indicator
4. Enable alerts
During Trading:
1. Wait for signal
2. Check star rating (4-5 only)
3. Verify "Safe to Trade" = YES
4. Enter with proper position size
5. Set SL/TP from boxes
6. Walk away (don't watch tick-by-tick)
After Trading:
1. Review trades in journal
2. What worked? What didn't?
3. Were they 4-5 star signals?
4. Did you follow rules?
5. Plan improvements
Position Sizing:
The 1% Rule:
Account: $1000
Risk per trade: 1% = $10
If SL is 20 pips away:
Position size = $10 / 20 pips = $0.50/pip
Simple! Never risk more than you can afford to lose.
🎯 Success Tips
From Professional Traders:
Tip #1: Quality Over Quantity
"Better to take 3 excellent trades per week
than 20 mediocre trades per day."
→ Focus on 5-star signals at first
Tip #2: Respect the Stop Loss
"The indicator calculated it for a reason.
Moving stops = breaking risk management."
→ Set it and honor it, always
Tip #3: Take Partial Profits
"Bank some profit at TP1, let the rest run to TP2.
This keeps you profitable even if TP2 doesn't hit."
→ Close 50% at TP1 (yellow box)
Tip #4: Trade Best Sessions
"London and New York overlap (1-4 PM GMT)
is the most liquid time of day."
→ Watch for green+blue background
Tip #5: Keep Learning
"Every trade is a lesson.
Winners teach confidence, losers teach discipline."
→ Journal everything, review weekly
⚠️ Important Disclaimers
Realistic Expectations:
This is NOT:
❌ A get-rich-quick scheme
❌ A 100% win rate system
❌ A replacement for education
❌ A guarantee of profits
❌ Financial advice
This IS:
✅ A learning tool
✅ A signal system with good probability
✅ A risk management helper
✅ A starting point for beginners
✅ An educational indicator
Trading Risks:
⚠️ All trading involves risk
⚠️ You can lose money
⚠️ Never trade with money you can't afford to lose
⚠️ Start small, grow slowly
⚠️ Past performance ≠ future results
⚠️ Demo trade first!
🎁 Bonus: Beginner's Checklist
Before Every Trade:
□ Signal appeared (BUY or SELL arrow)
□ Star rating is 4 or 5 stars
□ Dashboard shows "Safe to Trade: ✅ YES"
□ Trend and signal agree (both bullish or bearish)
□ Trading during London/NY session
□ Stop Loss level identified (red box)
□ Take Profit level identified (green box)
□ Position size calculated (1% risk max)
□ Emotionally ready (not revenge trading)
□ Have clear mind (not tired/stressed)
If ALL checked → TRADE
If ANY missing → SKIP
🎯 Final Words
Trading doesn't have to be complicated.
Smart Beginner Pro proves that you can:
Get professional results as a beginner
Learn proper trading techniques
Manage risk automatically
Understand WHY trades work
Build confidence step by step
This is your starting point.
Add it to your chart. Watch it work. Learn from it. Grow with it.
Welcome to professional trading! 🚀
📈 Ready to Start?
1. Click "Add to favorites"
2. Apply to your chart
3. Enable alerts
4. Wait for your first 5-star signal
5. Start your trading journey TODAY!
Questions? Comments? Success stories?
Share below! 👇
Happy Trading! 🎓📊✨
Disclaimer: This indicator is for educational purposes. Trading involves risk. Always use proper risk management and never trade with money you cannot afford to lose. Past performance does not guarantee future results.

🎯 Wyckoff Scalping Pro V2🎯 Wyckoff Scalping Pro V2
Short Description:
Advanced Wyckoff methodology combined with order flow, liquidity analysis, and multi-factor scoring system. Professional-grade scalping and day trading tool with 10-point signal strength rating.
Full Description:
Wyckoff Scalping Pro V2 is a comprehensive trading system that combines classical Wyckoff methodology with modern Smart Money Concepts for precision entries in any timeframe.
🎯 What Makes This System Unique?
Unlike basic indicators that just show patterns, this system uses a 10-Point Scoring System to rate every potential trade:
Signal Strength Components:
✅ Wyckoff Patterns (3 points) - Spring, Upthrust, SOS, SOW
✅ Liquidity Grabs (2 points) - Smart Money stop hunts
✅ Trend Alignment (2 points) - Current timeframe trend
✅ HTF Alignment (2 points) - Higher timeframe confirmation
✅ Volume Confirmation (1 point) - Extreme volume spikes
Only signals with 5+ points are displayed, ensuring you only see high-probability setups!
🔥 Core Features
📊 1. Wyckoff Methodology
Four classic accumulation/distribution patterns:
SPRING (Bullish Reversal)
Price breaks below swing low
Quick recovery with volume
Stop losses swept → reversal up
3-point signal component
UPTHRUST (Bearish Reversal)
Price breaks above swing high
Quick rejection with volume
Bull trap → reversal down
3-point signal component
SOS (Sign of Strength)
Strong bullish candle after accumulation
Breakout with volume
Trend initiation signal
SOW (Sign of Weakness)
Strong bearish candle after distribution
Breakdown with volume
Downtrend initiation signal
💹 2. Order Flow Analysis
Order Blocks
Institutional buying/selling zones
Automatic detection based on strong moves
Limited to 10 zones for clean charts
Transparent boxes for minimal clutter
Fair Value Gaps (FVG)
Price imbalances likely to be filled
Minimum size filter (customizable)
Blue (bullish) and purple (bearish)
Maximum 8 gaps shown
Supply & Demand Zones (Optional)
Classic S/D methodology
Fresh zones only
Toggle on/off for preferences
Professional zone labeling
💧 3. Liquidity Analysis
Liquidity Grabs Detection
Identifies sweep of swing highs/lows
Confirms with volume and candle structure
Yellow labels for visibility
Only major liquidity events shown
Why This Matters:
Smart money often "hunts stops" by sweeping liquidity before reversing. These grabs are powerful reversal signals.
📈 4. Multi-Timeframe Trend Analysis
Current Timeframe:
Fast EMA (default: 9)
Slow EMA (default: 21)
Major trend EMA (default: 200)
Higher Timeframe:
Customizable HTF (default: 15min)
Automatic alignment check
Background tint shows HTF trend
Can require HTF confirmation for signals
🎯 5. Two Trading Modes
STRICT MODE (Default - Recommended)
Requires trend alignment
HTF must confirm
Minimum 5/10 strength
Higher win rate, fewer signals
Best for beginners
FAST MODE
No trend requirements
HTF optional
Minimum 5/10 strength
More signals, lower win rate
For experienced scalpers
📊 6. Live Dashboard
Real-time information panel showing:
Current TF trend (Bull/Bear)
HTF trend status
Volume analysis (Normal/High/Extreme)
Major trend (Above/Below 200 EMA)
Active signal (LONG/SHORT/WAIT)
Signal strength (X/10 points)
Operating mode (Strict/Fast)
⚙️ Customization
Signal Filter Settings:
Min Signal Strength: 3-9 (default: 5)
→ Higher = fewer but better signals
Signal Cooldown: 1-20 bars (default: 5)
→ Prevents signal spam
Strict Mode: ON/OFF
→ Requires trend + HTF alignment
Wyckoff Settings:
Wyckoff Period: 10+ (default: 20)
→ Lookback for pattern detection
Volume Threshold: 1.5+ (default: 2.0)
→ How much above average for confirmation
Order Flow:
Order Blocks: Toggle ON/OFF
Liquidity Grabs: Toggle ON/OFF
Fair Value Gaps: Toggle ON/OFF
FVG Min Size: 0.2-5% (default: 0.5%)
Supply/Demand Zones: Toggle ON/OFF (default: OFF)
Trend Filter:
Fast EMA: Default 9
Slow EMA: Default 21
Major EMA: Default 200
Use 200 EMA Filter: Toggle
Multi-Timeframe:
HTF Timeframe: Any (default: 15min)
Require HTF Alignment: Toggle
💡 How To Use
For Scalping (M1-M5):
Set HTF to M15
Use Strict Mode
Min Signal Strength: 6
Focus on liquidity grabs
Quick in and out
For Day Trading (M15-H1):
Set HTF to H1 or H4
Use Strict Mode
Min Signal Strength: 5
Watch all components
Swing for larger moves
For Swing Trading (H4-D1):
Set HTF to Daily or Weekly
Use Strict Mode
Min Signal Strength: 7
Disable S/D zones (less clutter)
Hold for days
🎯 Entry Rules
LONG Entry:
Required:
Green triangle appears below bar
Label shows "LONG"
Strength ≥ 5/10 in dashboard
Optional (for higher probability):
Strength 7+/10
Spring or SOS pattern present
Liquidity grab occurred
HTF shows green trend
Above 200 EMA
Stop Loss:
Below order block or swing low
10-20 pips buffer
Take Profit:
Next supply zone or opposite order block
Minimum 1:2 RRR
SHORT Entry:
Required:
Red triangle appears above bar
Label shows "SHORT"
Strength ≥ 5/10 in dashboard
Optional (for higher probability):
Strength 7+/10
Upthrust or SOW pattern present
Liquidity grab occurred
HTF shows red trend
Below 200 EMA
Stop Loss:
Above order block or swing high
10-20 pips buffer
Take Profit:
Next demand zone or opposite order block
Minimum 1:2 RRR
📊 Best Markets & Timeframes
✅ Forex
All major pairs (EUR/USD, GBP/USD, etc.)
Best on M5-H1
High liquidity = cleaner signals
✅ Gold (XAUUSD)
Excellent for scalping
M5-M15 optimal
Strong liquidity events
✅ Crypto
Bitcoin, Ethereum
M15-H1 recommended
Volatile = more opportunities
✅ Indices
S&P 500, NASDAQ, etc.
M15-H4 optimal
Clear trends
✅ Stocks
Large cap only
Day trading timeframes
Sufficient volume required
🔔 Alert System
Available Alerts:
🟢 LONG Entry Signal
🔴 SHORT Entry Signal
🟡 Bullish Liquidity Grab
🟡 Bearish Liquidity Grab
🔵 Spring Pattern
🔴 Upthrust Pattern
Alert Messages Include:
Ticker symbol
Current price
Signal strength (X/10)
Pattern type
Recommended Setup:
Enable LONG and SHORT entry alerts
Set to "Once Per Bar Close"
Notification to mobile app
📈 Performance Expectations
Realistic Win Rates:
Strict Mode (5/10 min, with trend):
Win Rate: 65-75%
Signals: 3-8 per day (M15)
Best for: Most traders
Strict Mode (7/10 min, HTF aligned):
Win Rate: 75-85%
Signals: 1-3 per day (M15)
Best for: Conservative traders
Fast Mode (5/10 min, no filters):
Win Rate: 55-65%
Signals: 10-20 per day (M15)
Best for: Experienced scalpers
With Liquidity Grabs:
Win Rate: +10-15% increase
Reversal probability very high
Combine with Wyckoff for best results
💎 Pro Tips
Tip #1: Combine Patterns
Best Setup = Liquidity Grab + Spring/Upthrust
→ 80%+ win rate
→ Smart money confirmed on both sides
Tip #2: Use Signal Strength
5-6 points = OK to trade
7-8 points = Excellent trade
9-10 points = Rare, perfect setup
Tip #3: HTF Alignment
When HTF agrees with signal:
→ Larger position size allowed
→ Wider profit targets
→ Higher probability
Tip #4: Volume Matters
"EXTREME" volume in dashboard:
→ Institutional activity confirmed
→ Higher confidence in setup
→ Stronger moves expected
Tip #5: Clean Charts
Turn OFF S/D zones for day trading
Keep only Order Blocks + FVG
Less clutter = better focus
Tip #6: Signal Cooldown
Increase cooldown during:
→ Low volatility periods
→ Range-bound markets
→ To avoid overtrading
Decrease cooldown during:
→ High volatility
→ Trending markets
→ Major news events
🎨 Visual Design
Clean & Professional:
Minimal chart clutter
Only essential information
Transparent zones (92-95%)
Clear signal markers
Professional color scheme
Information Hierarchy:
Entry signals = LARGEST (impossible to miss)
Liquidity grabs = Medium (yellow labels)
Wyckoff patterns = Small (diamonds)
Zones = Transparent backgrounds
🆚 Comparison to Other Indicators
vs. Basic Order Block Indicators:
✅ Multi-factor scoring system
✅ Wyckoff patterns included
✅ Liquidity analysis built-in
✅ HTF confirmation
✅ Volume analysis vs. Simple Wyckoff Indicators:
✅ Order flow integration
✅ Fair value gaps
✅ Signal strength rating
✅ Multi-timeframe analysis
✅ Professional dashboard vs. Complex "All-in-One" Tools:
✅ Not overwhelming
✅ Focused on what matters
✅ Clean visual design
✅ Fast calculations
✅ Beginner-friendly with pro features
🎯 Who Is This For?
✅ Perfect For:
Scalpers (M1-M5)
Day traders (M15-H1)
Swing traders (H4-D1)
Traders learning Wyckoff
Anyone wanting quality over quantity
Traders seeking multi-confirmation
⚠️ Not Ideal For:
Complete beginners (learn basics first)
"Signal chasers" wanting 50+ signals/day
Traders who don't use stop losses
Very long-term investors
📚 Educational Value
This indicator teaches you:
Classical Wyckoff methodology
How institutions hunt liquidity
Order flow analysis
Multi-timeframe confluence
Volume analysis importance
Risk management through scoring
Learn while you trade!
⚡ Technical Specifications
Pine Script v5
Optimized for speed
No repainting
Real-time calculations
Maximum 200 boxes (clean limits)
Maximum 200 lines
Efficient array management
Works on all liquid markets
🚀 Getting Started (Quick Guide)
Add to Chart
Apply to your favorite pair
Default settings work well
Choose Your Mode
Strict Mode: ON (recommended)
HTF: Set to 15min (or higher for H1+ charts)
Set Alerts
LONG Entry Signal
SHORT Entry Signal
Start Small
Demo trade first
Watch signal strength
Learn the patterns
Scale Up
Once comfortable
Increase position size
Focus on 7+ strength signals
🎯 Final Thoughts
Wyckoff Scalping Pro V2 is not just an indicator - it's a complete trading system that respects your screen space while giving you professional-grade analysis.
The 10-point scoring system ensures you're never guessing about signal quality. You always know exactly how strong a setup is before entering.
Quality over quantity - This system prioritizes high-probability setups over signal spam. You might see 3-8 signals per day on M15, and that's exactly the point. Each one is carefully filtered.
📞 Support & Feedback
Questions? Drop a comment below!
Found this useful? Hit that ⭐ button!
Have suggestions? I'm listening!
Happy Trading! 🚀📈

🎯 Wyckoff Order Block Entry System🎯 Wyckoff Order Block Entry System
📝 INDICATOR DESCRIPTION
🎯 Wyckoff Order Block Entry System Short Description:
Professional institutional zone trading combined with Wyckoff methodology. Identifies high-probability entries where smart money meets classic price action patterns.
Full Description:
Wyckoff Order Block Entry System is a precision trading tool that combines two powerful concepts:
Order Blocks - Institutional zones where large players place their orders
Wyckoff Method - Classic price action patterns revealing smart money behavior
🎯 What Makes This Different?
Unlike traditional indicators that flood your chart with signals, this system only triggers entries when BOTH conditions are met:
Price enters an institutional Order Block zone (current timeframe OR higher timeframe)
A Wyckoff pattern occurs (Spring, SOS, Upthrust, or SOW)
This dual-confirmation approach ensures you're trading with institutional flow at optimal entry points.
📊 Key Features:
✅ Order Block Detection
Automatically identifies institutional buying/selling zones
Current timeframe order blocks (solid lines)
Higher timeframe order blocks (dashed lines) for stronger zones
Customizable strength and extension settings
✅ 4 Wyckoff Entry Patterns
SPRING (Bullish Reversal): Fake breakdown below support → Quick recovery
SOS (Sign of Strength): Strong bullish candle after accumulation
UPTHRUST (Bearish Reversal): Fake breakout above resistance → Quick rejection
SOW (Sign of Weakness): Strong bearish candle after distribution
✅ Clean Visual Design
Minimalist approach - only essential information
Color-coded zones (Green = Bullish, Red = Bearish, Cyan/Magenta = HTF)
Clear entry signals with pattern type labels
No chart clutter - focus on what matters
✅ Multi-Timeframe Analysis
Integrates higher timeframe order blocks
HTF signals marked with "+HTF" tag for extra confidence
Fully customizable HTF selection (H1, H4, Daily, etc.)
✅ Smart Alerts
Entry signal alerts (Long/Short)
Order block formation alerts
HTF order block alerts
Customizable alert messages
💡 How To Use:
Setup: Add indicator to your chart, configure HTF timeframe (default H1)
Wait: Let order blocks form (green/red boxes appear)
Watch: Price returns to order block zone
Entry: Signal appears when Wyckoff pattern confirms
Trade: Enter with the signal, stop below/above order block
📈 Best For:
Forex pairs (all majors and crosses)
Gold (XAUUSD)
Crypto (BTC, ETH, etc.)
Indices (SPX, NAS100, etc.)
Stocks
Commodities
⏱️ Recommended Timeframes:
M15 for scalping
M30 for day trading
H1 for swing trading
H4 for position trading
🎯 Win Rate Expectations:
Current TF signals: 60-70%
HTF signals (+HTF tag): 70-80%
Spring/Upthrust patterns: Highest probability
Works on ALL liquid markets
⚙️ Customizable Settings:
Order block detection parameters
HTF timeframe selection
Wyckoff sensitivity (swing length, volume threshold)
Zone extension duration
Color schemes
📚 Trading Strategy:
This indicator works best when:
Trading in the direction of higher timeframe trend
Using proper risk management (1-2% per trade)
Placing stops just outside order block zones
Taking profits at opposite order blocks
Focusing on HTF signals for higher quality
🔒 Risk Management:
Always use stop losses! Recommended placement:
LONG: 10-20 pips below order block
SHORT: 10-20 pips above order block
Target: Minimum 1:2 risk/reward ratio
💎 Why Traders Love This System:
"Finally, an indicator that doesn't spam my chart with useless signals!" - The quality-over-quantity approach means you only get high-probability setups.
"The HTF order blocks changed my trading!" - Multi-timeframe analysis built-in removes the need for manual higher timeframe checks.
"Wyckoff + Order Blocks = Perfect combination!" - Two proven concepts working together create powerful confluence.
📊 Universal Application:
This system works on ANY liquid market with sufficient volume:
✅ Forex (EUR/USD, GBP/USD, USD/JPY, etc.)
✅ Commodities (Gold, Silver, Oil, etc.)
✅ Indices (S&P 500, NASDAQ, DAX, etc.)
✅ Cryptocurrencies (Bitcoin, Ethereum, etc.)
✅ Stocks (Large cap with good liquidity)
🎓 Educational Value:
Beyond just signals, this indicator teaches you:
How institutional traders think
Where smart money places orders
Classic Wyckoff accumulation/distribution patterns
Multi-timeframe analysis techniques
⚡ Performance:
Lightning-fast calculations
No repainting
Real-time signal generation
Clean code, optimized for speed
🚀 Get Started:
Add to your favorite chart
Adjust HTF timeframe to match your trading style
Wait for high-quality signals
Trade with confidence
Remember: Quality beats quantity. This system prioritizes precision over frequency. You might see 2-5 signals per day on M30 - and that's exactly the point. Each signal is carefully filtered for maximum probability.
Ready to trade like institutions?
👉 Add this indicator to your chart now
👉 Configure your preferred HTF timeframe
👉 Start catching high-probability setups
👉 Trade smarter, not harder
Questions or feedback? Drop a comment below!
Found this useful? Hit that ⭐ button and share with fellow traders!
Happy Trading! 🚀📈

GLD Levels on GC## GLD Levels on GC - Advanced Gold Trading Indicator
The GLD Levels indicator is a sophisticated trading tool designed specifically for gold traders who want to visualize key psychological price levels from the GLD ETF directly on their Gold futures (GC) charts. This indicator automatically scales GLD price levels to match Gold futures pricing, providing crucial support and resistance levels that institutional and retail traders watch closely.
### Key Features
- Real-Time GLD Price Integration : Pulls live GLD ETF prices and displays them as scaled levels on GC charts
- Dual Level System : Shows both whole number levels (e.g., $180, $181, $182) and half levels (e.g., $180.5, $181.5, $182.5)
- Smart Instrument Detection : Automatically works on GLD, GC (Gold futures), and MGC (Micro Gold futures) with proper scaling
- Customizable Colors : Full control over line and label colors for both whole number and half levels
- Historical Extension : Lines extend 100 bars back and 50 bars forward for comprehensive chart analysis
- Dynamic Level Selection : Always shows the 10 closest levels (5 above, 5 below) to current price
- Clean Label System : Optional price labels with "GLD: $XXX" format for easy identification
### How It Works
The indicator fetches real-time GLD ETF prices and calculates the nearest whole number and half-increment levels. When used on Gold futures charts (GC/MGC), it automatically applies the appropriate conversion ratio to scale GLD levels to futures pricing. This provides traders with the psychological levels that matter most in the gold market.
### Customization Options
- Show GLD Price Label : Toggle the current GLD price display
- Show Whole Number Levels : Enable/disable whole dollar level lines
- Show Half Levels : Enable/disable $0.50 increment levels
- Whole Number Level Color : Customize the color for whole dollar levels (default: white)
- Half Level Color : Customize the color for half-dollar levels (default: gray with transparency)
### Perfect For
- Gold Futures Traders : GC and MGC contract traders who need GLD-based support/resistance levels
- Multi-Timeframe Analysis : Works across all timeframes from scalping to swing trading
- Institutional Level Tracking : Monitor the same levels that large funds and ETF traders watch
- Risk Management : Use levels for stop-loss placement and profit target identification
- Market Structure Analysis : Identify key psychological levels that often act as magnets for price action
### Trading Applications
- Support & Resistance : Use GLD levels as dynamic support and resistance zones
- Entry Points : Look for bounces or breaks at key whole number and half levels
- Profit Targets : Scale out positions at significant GLD psychological levels
- Stop Loss Placement : Position stops beyond key levels for better risk management
- Breakout Trading : Monitor for decisive breaks above/below major GLD levels
### Why GLD Levels Matter for Gold Futures
GLD is the world's largest gold ETF with massive institutional participation. The psychological levels in GLD often translate directly to Gold futures markets due to arbitrage relationships and cross-market trading. This indicator bridges that gap by showing you exactly where these critical levels sit on your Gold futures charts.

Smart TP Manager - FREE Edition📘 Smart TP Manager - User Guide
🎯 Parameter Adaptation by Timeframe
IMPORTANT: Default parameters are optimized for M5 (5 minutes). If you trade on other timeframes, you MUST adapt the parameters for better results.
📊 Recommended Settings Table
M1 (1 minute) - Ultra Scalping
ATR SL Multiplier: 1.5 - 1.8
Number of TPs: 3 - 4
Base RR: 0.4 - 0.5
Confirmation Bars: 2
Cooldown: 3 - 5 bars
Breakeven: Enable after TP1
Profile: Very fast trades, immediate exits, tight SL
M5 (5 minutes) - Scalping ✅ DEFAULT
ATR SL Multiplier: 1.8 - 2.0
Number of TPs: 4 - 5
Base RR: 0.5 - 0.6
Confirmation Bars: 2 - 3
Cooldown: 5 - 8 bars
Breakeven: Enable after TP1 or TP2
Profile: Standard scalping, balance between speed and security
M15 (15 minutes) - Intraday
ATR SL Multiplier: 2.0 - 2.2
Number of TPs: 5 - 6
Base RR: 0.6 - 0.8
Confirmation Bars: 3
Cooldown: 8 - 10 bars
Breakeven: Enable after TP2
Profile: Intraday trading, 3-8 trades per day
H1 (1 hour) - Swing
ATR SL Multiplier: 2.2 - 2.5
Number of TPs: 5 - 6
Base RR: 0.8 - 1.0
Confirmation Bars: 3 - 4
Cooldown: 10 - 15 bars
Breakeven: Enable after TP2 or TP3
Profile: Swing trading, 1-3 trades per day
H4 (4 hours) - Position
ATR SL Multiplier: 2.5 - 3.0
Number of TPs: 6
Base RR: 1.0 - 1.2
Confirmation Bars: 4 - 5
Cooldown: 15 - 20 bars
Breakeven: Enable after TP3
Profile: Position trading, multi-day trades
🔍 Adaptation Logic
General Rule:
LOWER Timeframe → TIGHTER Parameters
HIGHER Timeframe → WIDER Parameters
Why Adapt?
1. ATR SL Multiplier
M1: Very volatile market, fast moves → Tight SL (1.5-1.8)
H4: Slow moves, breathing room needed → Wide SL (2.5-3.0)
2. Number of TPs
M1: Quick exits before reversal → 3-4 TPs
H4: Let profits run → 6 TPs
3. Base RR
M1: Close targets, quick exits → 0.4-0.5
H4: Ambitious targets, patience → 1.0-1.2
4. Confirmation Bars
M1: Fast entry, 2 candles enough
H4: Strong confirmation needed, 4-5 candles
5. Cooldown
M1: Multiple trades per hour possible → 3-5 bars
H4: Important spacing between trades → 15-20 bars
6. Breakeven
M1: Immediate protection after TP1
H4: Let trade breathe, BE after TP3
💡 Real Examples
Example 1: Gold M1 Scalping
Goal: 10-20 trades/day, ultra-fast exits
Recommended Parameters:
- ATR SL: 1.6
- TPs: 4
- Base RR: 0.5
- Confirmation: 2
- Cooldown: 5
- BE: ON after TP1
Expected Results:
- Winrate: 40-50%
- Net P/L: +3 to +6R per day
- SL: 10-15 pips
- TP1: 5-8 pips (quick exit)
Example 2: Gold M15 Day Trading
Goal: 3-6 trades/day, let it breathe
Recommended Parameters:
- ATR SL: 2.1
- TPs: 5
- Base RR: 0.7
- Confirmation: 3
- Cooldown: 10
- BE: ON after TP2
Expected Results:
- Winrate: 50-60%
- Net P/L: +5 to +10R per day
- SL: 20-30 pips
- TP1: 14-21 pips
Example 3: Gold H1 Swing Trading
Goal: 1-2 trades/day, maximum patience
Recommended Parameters:
- ATR SL: 2.4
- TPs: 6
- Base RR: 0.9
- Confirmation: 4
- Cooldown: 12
- BE: ON after TP2
Expected Results:
- Winrate: 55-65%
- Net P/L: +8 to +15R per week
- SL: 40-60 pips
- TP1: 36-54 pips
⚠️ Common Mistakes to Avoid
❌ MISTAKE #1: Using same parameters on all timeframes
M1 with ATR SL 2.5 → SL too wide, huge losses
H4 with ATR SL 1.5 → SL too tight, constant stop outs
❌ MISTAKE #2: Too many TPs on low timeframe
M1 with 6 TPs → Impossible to reach all TPs
❌ MISTAKE #3: Too long confirmation on M1
M1 with 5 confirmation bars → Misses all fast moves
❌ MISTAKE #4: Too short cooldown on H4
H4 with 3 bars cooldown → Overtrading, too many poor-quality trades
🎯 Testing Methodology
Step 1: Start with recommended values
Use the table above according to your timeframe
Step 2: Backtest on minimum 100 trades
Observe:
Winrate
Net P/L in R
Number of BE hits
Trade frequency
Step 3: Adjust based on results
If too many SL hits:
↑ Increase ATR SL Multiplier by +0.2
↑ Increase Confirmation Bars by +1
If not enough trades:
↓ Reduce Cooldown by -2
↓ Reduce Confirmation Bars by -1
If TPs never reached:
↓ Reduce Number of TPs by -1
↓ Reduce Base RR by -0.1
If too many BE but no real wins:
↑ Increase Base RR by +0.1
Disable BE temporarily
📈 Performance Tracking
Key indicators by timeframe:
TFTrades/DayMin WinrateNet P/L/DayAvg SL (pips)M110-2040%+3R10-15M55-1245%+4R15-20M153-850%+5R20-30H11-455%+3R40-60H40.5-260%+2R80-120
🚀 Final Advice
DO NOT USE THE SAME PARAMETERS ON DIFFERENT TIMEFRAMES!
Each timeframe has its own dynamics. Adapting parameters is not optional, it's MANDATORY for optimal results.
Different timeframe = Different parameters = Different results
Quick Reference Chart
M1 → AGGRESSIVE (tight SL, few TPs, quick BE)
M5 → BALANCED (default settings)
M15 → MODERATE (wider SL, more TPs)
H1 → PATIENT (wide SL, max TPs, late BE)
H4 → CONSERVATIVE (very wide SL, all TPs, very late BE)
📝 Best Practices
Always backtest on your specific timeframe before live trading
Start conservative - use higher ATR multipliers first
Track your stats - Wins, Losses, BE, Net P/L
Adjust gradually - change one parameter at a time
Respect your timeframe - don't force H4 parameters on M1
Use breakeven wisely - protect profits but don't choke trades
Monitor cooldown - too many trades = lower quality
🎓 Understanding the Strategy
EMA 9/21 Crossover
BUY: EMA9 crosses above EMA21
SELL: EMA9 crosses below EMA21
RSI Filter
Avoids overbought (>70) for longs
Avoids oversold (<30) for shorts
Confirmation System
Requires X consecutive candles meeting conditions
Reduces false signals
Take Profit Structure
Non-linear TP levels
TP1: 0.5R (default)
TP2: 1.0R
TP3: 1.5R
TP4: 2.0R
TP5: 2.5R
Risk Management
ATR-based stop loss (adapts to volatility)
Optional breakeven after specified TP
Cooldown prevents overtrading
🌟 Pro Tips
Gold (XAUUSD) specific: Use tighter parameters than forex pairs
NY Session: More volatility, tighter SL recommended
Asian Session: Lower volatility, consider skipping or wider SL
News events: Increase cooldown before/after major news
Trending markets: Increase Number of TPs
Ranging markets: Decrease Number of TPs, faster exits
Happy Trading! 🎯
Remember: Past performance does not guarantee future results. Always use proper risk management and never risk more than you can afford to lose.

Adaptive Trend & Momentum [ATM] - All-in-One Confirmation Tired of Cluttered Charts and Conflicting Signals? This All-in-One Indicator is Your Solution.
The Adaptive Trend & Momentum (ATM) indicator is a powerful, next-generation trading tool designed to eliminate chart clutter and provide clear, high-conviction signals. Instead of using multiple conflicting indicators, the ATM system combines trend, momentum, and volatility into a single, cohesive, and adaptive framework. It automatically adjusts to changing market conditions, giving you a reliable edge in any environment.
This is not just another moving average crossover. It is a complete trading system that helps you identify the trend, confirm its strength, and time your entries with precision.
Key Features
•
Adaptive Moving Average (AMA): The core of the system. The AMA automatically adjusts its length based on market volatility (using the Average True Range). It becomes faster and more responsive in volatile markets to catch moves early, and smoother in calm markets to avoid noise and false signals.
•
Dynamic Volatility Bands: These bands expand and contract based on market volatility, providing a dynamic map of support and resistance. They are crucial for identifying pullback opportunities and setting effective stop-loss levels.
•
Integrated Momentum Oscillator: A smoothed RSI-based oscillator that runs in a separate pane. It is designed to confirm the signals from the main chart. The oscillator and its histogram are color-coded to show whether bullish or bearish momentum is in control, giving you an instant read on market strength.
•
Clear Consensus Signals: The ATM indicator provides four distinct, easy-to-read signals directly on your chart:
•
STRONG BUY: The highest-conviction signal, appearing when the trend is bullish, momentum is bullish, and the price has pulled back to a strategic entry zone near the AMA.
•
BUY: A standard confirmation signal when both trend and momentum are aligned to the upside.
•
STRONG SELL: The highest-conviction short signal, appearing when the trend is bearish, momentum is bearish, and the price has rallied to a strategic entry zone.
•
SELL: A standard confirmation signal when both trend and momentum are aligned to the downside.
•
Real-Time Dashboard: A convenient on-chart table that provides a complete overview of the market at a glance. It shows the current adaptive length, trend direction, momentum status, consensus signal, and volatility percentage, so you always know what the indicator is thinking.
How It Works: The Adaptive Engine
The magic of the ATM indicator lies in its adaptive engine. Traditional moving averages use a fixed length (e.g., 50-period MA), which can be too slow in a fast market or too sensitive in a choppy one. The ATM’s Adaptive Moving Average solves this by dynamically adjusting its calculation period in real-time:
When volatility increases, the AMA shortens its length to react more quickly to price changes. When volatility decreases, it lengthens its period to smooth out noise and prevent false signals.
This adaptive nature ensures that the indicator remains relevant and effective across different assets and timeframes, from scalping to swing trading.
How to Use This Indicator: A Simple Trading Strategy
The ATM indicator is designed for clarity and ease of use. Here is a basic framework for trading with it:
For Long (Buy) Positions:
1.
Identify the Trend: Wait for the Adaptive Moving Average (AMA) line to turn green, indicating a confirmed uptrend.
2.
Confirm with Momentum: Check that the momentum oscillator is above 50 and preferably rising, confirming bullish strength.
3.
Find Your Entry: The best entry is a "STRONG BUY" signal. This tells you that the price has pulled back to a value area within the uptrend, offering a high-probability entry. A standard "BUY" signal can also be used, but the conviction is higher on "STRONG" signals.
4.
Set Your Stop-Loss: A logical place for a stop-loss is just below the lower volatility band.
5.
Take Profit: Consider taking profits when an opposing "SELL" or "STRONG SELL" signal appears, or when the price reaches a key resistance level.
For Short (Sell) Positions:
1.
Identify the Trend: Wait for the Adaptive Moving Average (AMA) line to turn red, indicating a confirmed downtrend.
2.
Confirm with Momentum: Check that the momentum oscillator is below 50 and preferably falling, confirming bearish strength.
3.
Find Your Entry: The best entry is a "STRONG SELL" signal. This indicates the price has rallied to a resistance area within the downtrend, offering a prime shorting opportunity. A standard "SELL" signal can also be used.
4.
Set Your Stop-Loss: A logical place for a stop-loss is just above the upper volatility band.
5.
Take Profit: Consider taking profits when an opposing "BUY" or "STRONG BUY" signal appears, or when the price reaches a key support level.
Customization and Settings
The indicator is fully customizable to fit your trading style and the asset you are trading. You can adjust:
•
AMA Settings: Control the base length and the volatility multiplier to make the indicator more or less sensitive.
•
Momentum Settings: Adjust the RSI length and smoothing for the oscillator.
•
Volatility Bands: Change the multiplier to widen or narrow the bands.
•
Visuals: Toggle signals, labels, and the dashboard on or off, and customize all colors to your preference.
Summary
The Adaptive Trend & Momentum (ATM) indicator is more than just a tool; it is a complete system for making more confident trading decisions. By adapting to the market and combining trend, momentum, and volatility, it provides a clear, uncluttered, and powerful view of price action.
Add it to your chart today and experience the clarity of adaptive trading!
Disclaimer: This indicator is a tool for technical analysis and should not be considered financial advice. Trading involves risk, and you should always use proper risk management. Past performance is not indicative of future results. Practice on a demo account before trading with real capital.
Keywords: Adaptive, Moving Average, Trend, Momentum, Volatility, RSI, Bands, Signal, Confirmation, All-in-One, System, Strategy, ATR, Volatility, Dashboard, Alert

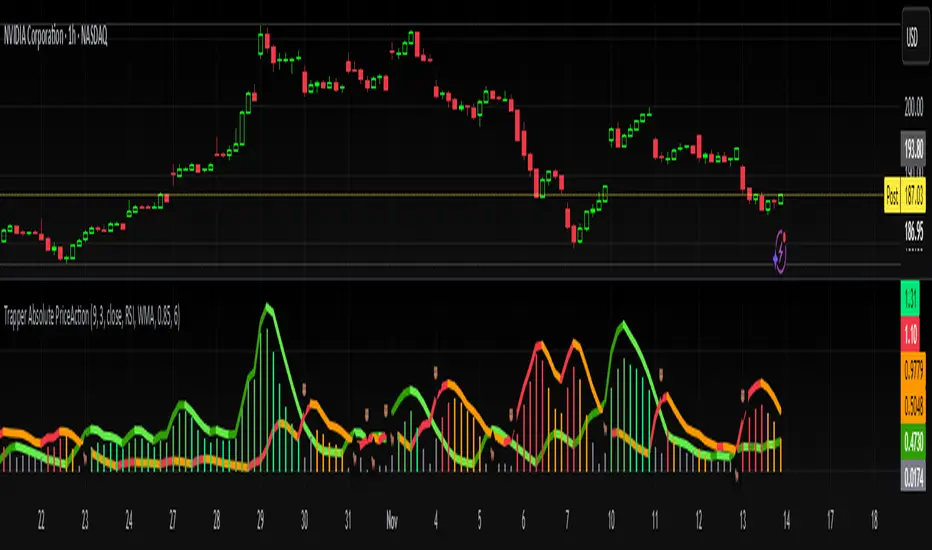
Trapper Absolute PriceActionThe Trapper Absolute PriceAction (TAPA) indicator is a custom, momentum-based oscillator designed to help traders visually read shifts in bullish and bearish price strength — with no reliance on volume or external data.
TAPA calculates and smooths both bullish and bearish momentum using multiple methods (RSI, Stochastic, or ADX) and compares their relative strength in real time. The result is a clean dual-line oscillator with color-coded histograms that highlight which side of the market currently has control.
It was built to give traders a sniper-level precision tool for detecting early momentum shifts before they appear clearly on price charts, allowing confirmation or invalidation of setups faster than with lagging indicators.
How It Works
Momentum Strength Calculation
The script measures directional price movement across the chosen mode (RSI, Stochastic, or ADX).
These values are smoothed twice using a selectable moving average type (WMA, EMA, SMA, ALMA, HMA, etc.).
Bullish & Bearish Curves
The green line represents smoothed bullish momentum (SmthBulls).
The orange/red line represents smoothed bearish momentum (SmthBears).
Histogram Strength Visualization
The distance between the two curves forms a color-coded histogram.
Green/Lime bars indicate growing bullish control, while Orange/Red bars show bearish dominance.
A gray neutral zone reflects indecision or range-bound conditions.
Signal Triggers
BUY 🐂 appears when the green line crosses up through the orange — signaling a bullish momentum flip.
SELL 🐻 appears when the green line crosses down through the orange — signaling bearish control.
Alerts can be enabled directly in TradingView through the BUY (🐂) or SELL (🐻) alert conditions for automated notifications or integrations.
How to Use
1. Confirm Early Momentum Shifts
When a crossover appears, check that the histogram color supports the move (green shades for bullish, red/orange for bearish).
Avoid signals when both lines are tangled and the histogram alternates gray, that usually indicates consolidation or low volatility.
2. Validate with Higher-Timeframe Structure
TAPA is most powerful when aligned with trend structure from higher timeframes.
Example: A bullish crossover on the 1-hour timeframe, while the daily TAPA shows the green line already rising, can confirm momentum alignment before entry.
3. Combine with Support/Resistance
Mark your key support and resistance zones (manual or using your “Trapper S&R PRO” indicator).
Look for a TAPA bullish crossover occurring at a major support zone, that’s often the start of a reversal move.
4. Multi-Mode Analysis
Experiment with “Indicator Method” in the inputs:
RSI Mode - smoother and responsive for swing trading.
Stochastic Mode - better for short-term entries and exits.
ADX Mode - captures trending momentum on strong breakouts.
Examples
Bullish Example:
Price forms a higher low on the chart while TAPA’s green line crosses up through orange with a lime/green histogram. That’s a strong early signal that momentum is reversing before price confirms on structure.
Bearish Example:
Price rallies into resistance, then TAPA shows a red histogram and a bearish cross (green dropping under orange). That’s typically a high-probability short signal once structure breaks.
What Makes TAPA Different
No Volume Dependency: Focuses purely on price behavior, not volume spikes or anomalies.
Multi-Mode Engine: Switch between RSI, Stochastic, or ADX-style momentum math instantly.
Customizable Visuals: Editable histogram color layers (weak/strong bull/bear, neutral) and line color control.
Sniper Labeling System: Clean, minimal BUY/SELL cues at each verified crossover.
Alert-Ready: Built-in conditions allow for TradingView alerts, webhooks, or bot automation.
Modernized Core: Rebuilt in Pine v6 with optimized performance and compliance to TradingView standards.
TAPA is designed to filter out the noise and show what truly drives a move — the shift in control between buyers and sellers.
Best Pairing Indicators
To get maximum clarity and confluence:
Trapper Support & Resistance PRO
Helps identify key zones where momentum flips from TAPA have the most impact. A bullish crossover at a defined support level often marks an early trend reversal.
Trapper Volume Trigger
While TAPA doesn’t use volume internally, pairing it with a volume-based trigger confirms that momentum shifts have institutional participation.
Simple Moving Averages (5, 20, or 50)
Overlay short and mid-term SMAs on your chart to confirm directional bias. A bullish TAPA cross that aligns with SMA-5 crossing above SMA-20 increases reliability.
Disclaimer
This indicator is provided for educational and analytical purposes only.
It does not constitute financial advice or a recommendation to buy or sell any security.
Always conduct your own due diligence and practice proper risk management before trading any strategy.
© 2025 RAMS-offthecharts | “Read • Analyze • Mark • Snipe.”
TAPA is part of the RAMS ecosystem of tactical market tools, designed for traders who focus on precision, discipline, and momentum awareness.
TraderDemircan Auto Fibonacci RetracementDescription:
What This Indicator Does:This indicator automatically identifies significant swing high and swing low points within a customizable lookback period and draws comprehensive Fibonacci retracement and extension levels between them. Unlike the manual Fibonacci tool that requires you to constantly redraw levels as price action evolves, this automated version continuously updates the Fibonacci grid based on the most recent major swing points, ensuring you always have current and relevant support/resistance zones displayed on your chart.Key Features:
Automatic Swing Detection: Continuously scans the specified lookback period to find the most significant high and low points, eliminating manual drawing errors
Comprehensive Level Coverage: Plots 16 Fibonacci levels including 7 retracement levels (0.0 to 1.0) and 9 extension levels (1.115 to 3.618)
Top-Down Methodology: Draws from swing high to swing low (right-to-left), following the traditional Fibonacci retracement convention where 100% is at the top
Dual Labeling System: Shows both exact price values and Fibonacci percentages for easy reference
Complete Customization: Individual toggle controls and color selection for each of the 16 levels
Flexible Display Options: Adjust line thickness (1-5), style (solid/dashed/dotted), and extension direction (left/right/both)
Visual Swing Markers: Red diamond at the swing high (starting point) and green diamond at the swing low (ending point)
Optional Trend Line: Connects the two swing points to visualize the overall price movement direction
How It Works:The indicator employs a sophisticated swing point detection algorithm that operates in two stages:Stage 1 - Find the Swing Low (Support Base):
Scans the entire lookback period to identify the lowest low, which becomes the anchor point (0.0 level in traditional retracement terms, though displayed at the bottom of the grid).Stage 2 - Find the Swing High (Resistance Peak):
After identifying the swing low, searches for the highest high that occurred after that low point, establishing the swing range. This creates a valid price movement range for Fibonacci analysis.Fibonacci Calculation Method:
The indicator uses the top-down approach where:
1.0 Level = Swing High (100% retracement, the top)
0.0 Level = Swing Low (0% retracement, the bottom)
Retracement Levels (0.236 to 0.786) = Potential support zones during pullbacks from the high
Extension Levels (1.115 to 3.618) = Potential target zones below the swing low
Formula: Price = SwingHigh - (SwingHigh - SwingLow) × FibonacciLevelThis ensures that 0.0 is at the bottom and extensions (>1.0) plot below the swing low, following standard Fibonacci retracement convention.Fibonacci Levels Explained:Retracement Levels (0.0 - 1.0):
0.0 (Gray): Swing low - the base support level
0.236 (Red): Shallow retracement, first minor support
0.382 (Orange): Moderate retracement, commonly watched support
0.5 (Purple): Psychological midpoint, significant support/resistance
0.618 (Blue - Golden Ratio): The most important retracement level, high-probability reversal zone
0.786 (Cyan): Deep retracement, last defense before full reversal
1.0 (Gray): Swing high - the initial resistance level
Extension Levels (1.115 - 3.618):
1.115 (Green): First extension, minimal downside target
1.272 (Light Green): Minor extension, common profit target
1.414 (Yellow-Green): Square root of 2, mathematical significance
1.618 (Gold - Golden Extension): Primary downside target, most watched extension level
2.0 (Orange-Red): 200% extension, psychological round number
2.382 (Pink): Secondary extension target
2.618 (Purple): Deep extension, major target zone
3.272 (Deep Purple): Extreme extension level
3.618 (Blue): Maximum extension, rare but powerful target
How to Use:For Retracement Trading (Buying Pullbacks in Uptrends):
Wait for price to make a significant move up from swing low to swing high
When price starts pulling back, watch for reactions at key Fibonacci levels
Most common entry zones: 0.382, 0.5, and especially 0.618 (golden ratio)
Enter long positions when price shows reversal signals (candlestick patterns, volume increase) at these levels
Place stop loss below the next Fibonacci level
Target: Return to swing high or higher extension levels
For Extension Trading (Profit Targets):
After price breaks below the swing low (0.0 level), use extensions as profit targets
First target: 1.272 (conservative)
Primary target: 1.618 (golden extension - most commonly reached)
Extended target: 2.618 (for strong trends)
Extreme target: 3.618 (only in powerful trending moves)
For Counter-Trend Trading (Fading Extremes):
When price reaches deep retracements (0.786 or below), look for exhaustion signals
Watch for divergences between price and momentum indicators at these levels
Enter reversal trades with tight stops below the swing low
Target: 0.5 or 0.382 levels on the bounce
For Trend Continuation:
In strong uptrends, shallow retracements (0.236 to 0.382) often hold
Use these as low-risk entry points to join the existing trend
Failure to hold 0.5 suggests weakening momentum
Breaking below 0.618 often indicates trend reversal, not just retracement
Multi-Timeframe Strategy:
Use daily timeframe Fibonacci for major support/resistance zones
Use 4H or 1H Fibonacci for precise entry timing within those zones
Confluence between multiple timeframe Fibonacci levels creates high-probability zones
Example: Daily 0.618 level aligning with 4H 0.5 level = strong support
Settings Guide:Lookback Period (10-500):
Short (20-50): Captures recent swings, more frequent updates, suited for day trading
Medium (50-150): Balanced approach, good for swing trading (default: 100)
Long (150-500): Identifies major market structure, suited for position trading
Higher values = more stable levels but slower to adapt to new trends
Pivot Sensitivity (1-20):
Controls how many candles are required to confirm a swing point
Low (1-5): More sensitive, identifies minor swings (default: 5)
High (10-20): Less sensitive, only major swings qualify
Use higher sensitivity on lower timeframes to filter noise
Individual Level Toggles:
Enable only the levels you actively trade to reduce chart clutter
Common minimalist setup: Show only 0.382, 0.5, 0.618, 1.0, 1.618, 2.618
Comprehensive setup: Enable all levels for maximum information
Visual Customization:
Line Thickness: Thicker lines (3-5) for presentation, thinner (1-2) for trading
Line Style: Solid for primary levels (0.5, 0.618, 1.618), dashed/dotted for secondary
Price Labels: Essential for knowing exact entry/exit prices
Percent Labels: Helpful for quickly identifying which Fibonacci level you're looking at
Extension Direction: Extend right for forward-looking analysis, left for historical context
What Makes This Original:While Fibonacci indicators are common on TradingView, this script's originality comes from:
Intelligent Two-Stage Detection: Unlike simple high/low finders, this uses a sequential approach (find low first, then find the high that occurred after it), ensuring logical price flow representation
Comprehensive Level Set: Includes 16 levels spanning from retracement to extreme extensions, more than most Fibonacci tools
Top-Down Methodology: Properly implements the traditional Fibonacci retracement convention (high to low) rather than the reverse
Automatic Range Validation: Only draws Fibonacci when both swing points are valid and in the correct temporal order
Dual Extension Options: Separate controls for extending lines left (historical context) and right (forward projection)
Smart Label Positioning: Places percentage labels on the left and price labels on the right for clarity
Visual Swing Confirmation: Diamond markers at swing points help users understand why levels are positioned where they are
Important Considerations:
Historical Nature: Fibonacci retracements are based on past price swings; they don't predict future moves, only suggest potential support/resistance
Self-Fulfilling Prophecy: Fibonacci levels work partly because many traders watch them, creating actual support/resistance at those levels
Not All Levels Hold: In strong trends, price may slice through multiple Fibonacci levels without pausing
Context Matters: Fibonacci works best when aligned with other support/resistance (previous highs/lows, moving averages, trendlines)
Volume Confirmation: The most reliable Fibonacci reversals occur with volume spikes at key levels
Dynamic Updates: The levels will redraw as new swing highs/lows form, so don't rely solely on static screenshots
Best Practices:
Don't Trade Blindly: Fibonacci levels are zones, not exact prices. Look for confirmation (candlestick patterns, indicators, volume)
Combine with Price Action: Watch for pin bars, engulfing candles, or doji at key Fibonacci levels
Use Stop Losses: Place stops beyond the next Fibonacci level to give trades room but limit risk
Scale In/Out: Consider entering partial positions at 0.5 and adding more at 0.618 rather than all-in at one level
Check Multiple Timeframes: Daily Fibonacci + 4H Fibonacci convergence = high-probability zone
Respect the 0.618: This golden ratio level is historically the most reliable for reversals
Extensions Need Strong Trends: Don't expect extensions to be hit unless there's clear momentum beyond the swing low
Optimal Timeframes:
Scalping (1-5 minutes): Lookback 20-30, watch 0.382, 0.5, 0.618 only
Day Trading (15m-1H): Lookback 50-100, all retracement levels important
Swing Trading (4H-Daily): Lookback 100-200, focus on 0.5, 0.618, 0.786, and extensions
Position Trading (Daily-Weekly): Lookback 200-500, all levels relevant for long-term planning
Common Fibonacci Trading Mistakes to Avoid:
Wrong Swing Selection: Choosing insignificant swings produces meaningless levels
Premature Entry: Entering as soon as price touches a Fibonacci level without confirmation
Ignoring Trend: Fighting the main trend by buying deep retracements in downtrends
Over-Reliance: Using Fibonacci in isolation without confirming with other technical factors
Static Analysis: Not updating your Fibonacci as market structure evolves
Arbitrary Lookback: Using the same lookback period for all assets and timeframes
Integration with Other Tools:Fibonacci + Moving Averages:
When 0.618 level aligns with 50 or 200 EMA, confluence creates stronger support
Price bouncing from both Fibonacci and MA simultaneously = high-probability trade
Fibonacci + RSI/Stochastic:
Oversold indicators at 0.618 or deeper retracements = strong buy signal
Overbought indicators at swing high (1.0) = potential reversal warning
Fibonacci + Volume Profile:
High-volume nodes aligning with Fibonacci levels create robust support/resistance
Low-volume areas near Fibonacci levels may see rapid price movement through them
Fibonacci + Trendlines:
Fibonacci retracement level + ascending trendline = double support
Breaking both simultaneously confirms trend change
Technical Notes:
Uses ta.lowest() and ta.highest() for efficient swing detection across the lookback period
Implements dynamic line and label arrays for clean redraws without memory leaks
All calculations update in real-time as new bars form
Extension options allow customization without modifying core code
Format.mintick ensures price labels match the symbol's minimum price increment
Tooltip on swing markers shows exact price values for precision

TraderDemircan (Triz Global) Automatic Extend FibonacciDescription
What This Indicator Does:
This indicator automatically identifies the most significant swing low and swing high points within a customizable lookback period and plots comprehensive Fibonacci retracement and extension levels between them. Unlike manual Fibonacci tools, this script continuously updates the levels based on the most recent price action, making it ideal for traders who want to identify key support/resistance zones without constantly redrawing Fibonacci levels.
Key Features:
Automatic Swing Point Detection: Scans the specified lookback period to find the lowest low (starting point) and the highest high (ending point) to establish the Fibonacci range
Comprehensive Level Coverage: Plots 18 Fibonacci levels ranging from 0.0 (minimum) to 3.618 (maximum extension), including standard retracement levels (0.236, 0.382, 0.5, 0.618, 0.786) and popular extension levels (1.272, 1.414, 1.618, 2.0, 2.272, 2.382, 2.618, 3.0, 3.272, 3.618)
Visual Clarity: Each level is color-coded and can be individually toggled on/off for cleaner charts
Price and Percentage Labels: Shows both the actual price level and the Fibonacci percentage for easy reference
Flexible Display Options: Customize line width, style (solid/dashed/dotted), and extension direction
Dynamic Updates: Automatically recalculates levels as new price data becomes available
How It Works:
The indicator uses a left-to-right methodology, starting from the swing low (marked as 0.0 with a green diamond) and extending to the swing high (marked as 1.0 with a blue diamond). This approach follows natural price movement and makes the Fibonacci levels intuitive to read. The algorithm:
Identifies the lowest point within the lookback period (this becomes the 0.0 level)
Finds the highest point that occurred after the low point (this becomes the 1.0 level)
Calculates all retracement levels (0.0-1.0) and extension levels (above 1.0) based on this range
Plots horizontal lines with customizable styling and labels
How to Use:
For Retracement Trading: Watch for price reactions at key levels like 0.382, 0.5, and 0.618 (the Golden Ratio) during pullbacks in an uptrend
For Extension Targets: Use levels above 1.0 (especially 1.272, 1.414, and 1.618) to project potential profit targets
Adjust Sensitivity: Increase the "Pivot Sensibility" parameter for major swings only, or decrease it to capture more frequent price movements
Customize Lookback: Shorter periods (50-100 bars) work well for intraday trading, while longer periods (200-500 bars) suit swing trading and position trading
Settings:
Lookback Period: Controls how many candles back to search (10-500)
Pivot Sensibility: Determines the strength required to identify swing points (1-20)
Individual Level Toggles: Enable/disable any of the 18 Fibonacci levels
Visual Customization: Change colors, line thickness (1-5), and line style for each level
Label Options: Toggle price labels and percentage labels independently
Extension Controls: Choose to extend lines left, right, or both directions
What Makes This Original:
This indicator combines automatic swing detection with an extensive range of Fibonacci levels (18 total) that go well beyond the standard retracement tool. The left-to-right calculation methodology ensures logical level placement, while the comprehensive customization options allow traders to adapt the visual presentation to their specific trading style and chart setup.
Note: This indicator is designed for visual analysis and does not generate buy/sell signals. It's a tool to help identify potential support/resistance zones based on Fibonacci ratios. Always combine with other technical analysis methods and proper risk management.

Monthly, Weekly Open + Daily Pivot (Broken Lines, fixed)monthly open line weekly open and daily pivot
This TradingView indicator plots three key reference levels on your chart:
Monthly Open Line – shows the current month’s opening price.
Weekly Open Line – shows the current week’s opening price.
Daily Pivot Line – shows the pivot level based on the previous day’s high, low, and close.
Each line resets at the start of its new period (month, week, or day), so the lines are broken, not continuous.
You can fully customize visibility, color, and thickness for each line.
It helps traders quickly see market bias and important support/resistance levels for better intraday or swing trading decisions.

ATHENS Gold ICT + Smart Money [Advanced Signals]🎯 ADVANCED ICT + SMART MONEY CONFLUENCE INDICATOR
This indicator combines Inner Circle Trader (ICT) concepts with Smart Money theory to deliver high-probability trading signals based on institutional order flow and market structure.
━━━━━━━━━━━━━━━━━━━━━━━━━━━━━━━━━━━━━━━━
⚡ KEY FEATURES:
✅ ICT CONFLUENCE SYSTEM (0-4 Score)
• Order Blocks (Institutional Entry Zones)
• Fair Value Gaps (Price Imbalances)
• Liquidity Sweeps (Stop Hunt Detection)
• Market Structure (BOS & ChoCh)
✅ SMART SIGNALS
• Signals only trigger with minimum confluence
• Customizable requirements (OB/FVG/Liquidity)
• Filters out low-quality setups
• Higher win rate potential (65-85%)
✅ VISUAL COMPONENTS
• Order Blocks (OB+ / OB-)
• Fair Value Gaps (FVG↑ / FVG↓)
• Liquidity Zones (💧 markers)
• Break of Structure (BOS)
• Change of Character (ChoCh)
✅ PERSISTENT TP/SL LINES
• Entry, Stop Loss, TP1, TP2
• Automatically calculated from OB levels
• Lines extend across chart canvas
• Clear risk:reward visualization
✅ SMART DASHBOARD
• Real-time confluence score
• Component status (OB/FVG/Liquidity)
• Trend direction & RSI
• Signal strength indicator
━━━━━━━━━━━━━━━━━━━━━━━━━━━━━━━━━━━━━━━━
🎯 HOW IT WORKS:
The indicator scores each setup based on 4 key components:
1️⃣ ORDER BLOCK PRESENCE
• Bullish OB = Last bearish candle before strong move up
• Bearish OB = Last bullish candle before strong move down
• Price must be in OB zone
2️⃣ FAIR VALUE GAP (FVG)
• Gap between 3 candles indicating imbalance
• Price tends to fill these gaps
• Bounce from FVG = high probability entry
3️⃣ LIQUIDITY SWEEP
• Price sweeps recent high/low
• Retail stop losses triggered
• Smart money enters opposite direction
4️⃣ MARKET STRUCTURE
• Bullish = HH + HL
• Bearish = LH + LL
• Confirms trend direction
CONFLUENCE SCORE:
- 4/4 = Excellent (75-85% win rate)
- 3/4 = Good (65-75% win rate)
- 2/4 = Moderate (55-65% win rate)
- 1/4 = Weak (avoid)
━━━━━━━━━━━━━━━━━━━━━━━━━━━━━━━━━━━━━━━━
⚙️ CUSTOMIZABLE SETTINGS:
SIGNAL REQUIREMENTS:
- Require Order Block (ON/OFF)
- Require FVG (ON/OFF)
- Require Liquidity Sweep (ON/OFF)
- Minimum Confluence (1-4)
VISUAL SETTINGS:
- Show/Hide OB, FVG, BOS, ChoCh
- Adjustable lookback periods
- Customizable colors
- Line extension length
RISK MANAGEMENT:
- Risk:Reward ratio (1:1 to 5:1)
- Stop Loss buffer (%)
- Auto TP/SL calculation
- Clear old lines option
━━━━━━━━━━━━━━━━━━━━━━━━━━━━━━━━━━━━━━━━
📈 RECOMMENDED SETTINGS:
CONSERVATIVE (High Quality):
- Require OB: ON
- Require FVG: ON
- Min Confluence: 3/4
- Result: 1-2 signals/day, 70-80% win rate
BALANCED (Recommended):
- Require OB: ON
- Require FVG: OFF
- Min Confluence: 2/4
- Result: 2-4 signals/day, 60-70% win rate
AGGRESSIVE (More Signals):
- Require OB: OFF
- Require FVG: OFF
- Min Confluence: 2/4
- Result: 3-6 signals/day, 55-65% win rate
━━━━━━━━━━━━━━━━━━━━━━━━━━━━━━━━━━━━━━━━
🎯 BEST PRACTICES:
✅ Trade 3/4 or 4/4 confluence signals only
✅ Confirm with higher timeframe (H4/Daily)
✅ Trade during kill zones (London/NY open)
✅ Use proper position sizing (1-2% risk)
✅ Wait for all components to align
✅ Respect stop losses
✅ Take partial profits at TP1
❌ Don't trade 1/4 confluence signals
❌ Don't ignore liquidity sweeps
❌ Don't trade against higher TF trend
❌ Don't overtrade (quality > quantity)
━━━━━━━━━━━━━━━━━━━━━━━━━━━━━━━━━━━━━━━━
⚡ SIGNAL TYPES:
🟢 BUY SIGNAL (Green Triangle)
- Appears when bullish confluence met
- Label shows "BUY ICT"
- Blue entry line + Red SL + Green/Lime TPs
- Long opportunity
🔴 SELL SIGNAL (Red Triangle)
- Appears when bearish confluence met
- Label shows "SELL ICT"
- Blue entry line + Red SL + Green/Lime TPs
- Short opportunity
━━━━━━━━━━━━━━━━━━━━━━━━━━━━━━━━━━━━━━━━
📊 SUITABLE FOR:
- Gold (XAUUSD) - Optimized
- Forex pairs (Major pairs)
- Indices (US30, NAS100, SPX500)
- Crypto (BTC, ETH - adjust settings)
Recommended Timeframes:
- 15M - Primary for scalping
- 5M - Entry refinement
- 1H - Swing trading
- H4/Daily - Trend confirmation
━━━━━━━━━━━━━━━━━━━━━━━━━━━━━━━━━━━━━━━━
⚠️ DISCLAIMER:
This indicator is for educational purposes only. Past performance does not guarantee future results. Always:
- Practice on demo account first
- Use proper risk management
- Never risk more than you can afford to lose
- Seek professional financial advice
- Understand that trading carries risk
━━━━━━━━━━━━━━━━━━━━━━━━━━━━━━━━━━━━━━━━
🎓 BASED ON:
- ICT (Inner Circle Trader) Concepts
- Smart Money Theory
- Order Flow Analysis
- Institutional Trading Zones
- Market Structure Theory
━━━━━━━━━━━━━━━━━━━━━━━━━━━━━━━━━━━━━━━━
📢 FEATURES SUMMARY:
✅ Confluence-based signals (not random)
✅ Order Blocks + FVG + Liquidity integration
✅ Persistent TP/SL lines (scroll-friendly)
✅ Smart dashboard (real-time info)
✅ Customizable requirements
✅ High-probability setups
✅ Professional trading approach
✅ Works on multiple assets
✅ Clean visual presentation
✅ Beginner to advanced friendly
━━━━━━━━━━━━━━━━━━━━━━━━━━━━━━━━━━━━━━━━
Trade smart. Trade with confluence. 🎯
#ICT #SmartMoney #OrderBlocks #FVG #Gold #Forex #TradingStrategy #Confluence

One Step IndicatorOne Step Indicator V.3 – Precision Trend Engine for Modern Traders
One Step Indicator is a high-performance trend and momentum engine designed for traders who demand clarity, precision, and consistency.
This tool identifies market transitions in a single decisive step—highlighting trend continuation, momentum shifts, and reversal points with exceptional accuracy.
Built with a clean visual structure and optimized signal logic, the indicator generates only one actionable Buy/Sell signal per bar, reducing noise and helping traders stay focused on true market direction rather than chart clutter.
Key Features
• Adaptive Trend Cloud – Smooth dynamic cloud that filters noise and reveals the real market structure.
• Smart Reversal Signals – Buy/Sell markers triggered by momentum inflection and volatility compression.
• One-Signal-Per-Bar Logic – Eliminates duplicate alerts and keeps the chart clean and intuitive.
• Multi-Asset Compatible – Perfect for Gold, Forex, Crypto, Indices, and all major markets.
• Works on Any Timeframe – From fast-paced scalping to steady swing trading.
Why Traders Use It
Designed for traders who want a reliable system without complexity.
It combines trend detection + momentum confirmation into a single unified signal, giving traders a powerful edge in identifying early moves and avoiding false breakouts.
Recommended For
• Intraday & Scalping Traders
• Swing Traders
• Momentum & Trend Following Strategies
• Traders who prefer clean, minimalist, high-precision tools
Purpose
One Step Indicator helps you see the market’s intention at a glance—
One step. One signal. One direction.
Trade with confidence, not confusion.

MCM By Inner Racers# MCM By Inner Racers - Multi-Timeframe Key Levels & Session Indicator
## 📊 Overview
**MCM (Multi-Timeframe Chart Mapping)** is a comprehensive trading indicator designed for professional traders who need clear visual representation of critical price levels, session ranges, and time-based market structure. This all-in-one tool eliminates chart clutter while providing essential information for ICT, SMC, and institutional trading methodologies.
---
## ✨ Key Features
### 📅 **Previous Daily Levels**
- **Previous Day High (PDH)** - Acts as key resistance/liquidity zone
- **Previous Day Low (PDL)** - Acts as key support/liquidity zone
- **Previous Day Mid (PDM)** - 50% equilibrium level for mean reversion trades
- **Daily Separators** - Vertical lines marking new trading days
### 📆 **Previous Weekly Levels**
- **Previous Week High (PWH)** - Major weekly resistance for swing trading
- **Previous Week Low (PWL)** - Major weekly support for swing trading
- **Previous Week Mid (PWM)** - Weekly equilibrium for higher timeframe bias
- **Weekly Separators** - Vertical lines marking new trading weeks
### 🌅 **True Day Opens (TDO)**
- Displays opening prices at **midnight NY time** for the past 1-10 days
- Each level labeled as "TDO D-0", "TDO D-1", "TDO D-2", etc.
- Critical for tracking institutional reference points and gap trading
- Respects true midnight opens (not session opens)
### 📍 **Weekly Opens**
- **Monday 00:00 Open** - True weekly open at Monday midnight NY time
- **Sunday 17:00 Open** - Forex market open (Sunday 5 PM NY time)
- Essential for understanding weekly bias and manipulation zones
### 🌏 **Trading Session Ranges**
Dynamic session boxes that track real-time high/low ranges:
- **Asian Session** (Default: 20:00-00:00 NY) -
- **London Session** (Default: 02:00-05:00 NY) -
- **New York Session** (Default: 07:00-16:00 NY) -
All session times are **fully customizable** in 15-minute increments.
---
## 🎯 Who Is This For?
✅ **ICT/SMC Traders** - Key levels for market structure, liquidity, and order flow
✅ **Session Traders** - Identifying killzones and optimal entry zones
✅ **Swing Traders** - Previous day/week levels as support/resistance
✅ **Multi-Timeframe Analysts** - Understanding price relationships across timeframes
✅ **Forex & Indices Traders** - NY time-based analysis for institutional moves
---
## 🎨 Full Customization
Every element is fully customizable:
- ✏️ **Colors** - Match your chart theme perfectly
- 📏 **Line Widths** - 1-5 pixels for visibility
- 🎭 **Line Styles** - Solid, Dashed, or Dotted
- 🏷️ **Labels** - Custom text and 5 size options (Tiny to Huge)
- ⏱️ **Session Times** - Adjust to your timezone or broker
- 📐 **Line Extension** - 20-500 bars forward projection
- 👁️ **Toggle Visibility** - Show/hide any feature independently
---
## 🔧 Technical Highlights
- Uses **request.security()** for accurate higher timeframe data
- Implements **lookahead=barmerge.lookahead_on** for non-repainting levels
- All times calculated in **America/New_York timezone** for consistency
- Efficient line management with proper deletion/recreation
- Maximum 500 lines supported for clean chart performance
- Session detection respects broker time differences
---
## 📖 How To Use
### **For Day Traders:**
1. Enable Daily Levels + True Day Opens for intraday structure
2. Use Session Ranges to identify high-probability trading windows
3. Watch for price reactions at PDH/PDL and TDO levels
### **For Swing Traders:**
1. Enable Weekly Levels for higher timeframe bias
2. Use PWH/PWL as major support/resistance zones
3. Monitor Weekly Opens for institutional reference points
### **For Multi-Timeframe Analysis:**
1. Combine Daily + Weekly levels for confluence zones
2. Use Mid levels (50%) for mean reversion opportunities
3. Align session ranges with higher timeframe structure
---
## ⚙️ Setup Tips
- **Timeframe:** Works on all timeframes (recommended: 1m to 1H for intraday)
- **Chart Type:** Overlay indicator - displays directly on price chart
- **Clean Charts:** Toggle off features you don't need for specific strategies
- **Labels:** Turn off labels for cleaner charts, turn on for reference
- **Line Extension:** Adjust based on your screen size and bar count
---
## 🚀 What Makes This Different?
Unlike basic support/resistance indicators, MCM provides:
- ✅ **True NY midnight opens** (not session opens)
- ✅ **Multiple day opens** tracking (not just previous day)
- ✅ **Dynamic session ranges** (not static boxes)
- ✅ **Both true weekly opens** (Monday 00:00 AND Sunday 17:00)
- ✅ **Fully customizable everything** (colors, styles, labels, times)
- ✅ **Non-repainting levels** using proper lookahead settings
- ✅ **All-in-one solution** (no need for multiple indicators)
---
## 📝 Notes
- All times are in **America/New_York timezone** for consistency with institutional trading
- Previous levels update at the start of each new day/week
- Session ranges are calculated dynamically during active sessions
- Lines extend forward for clear visual reference
- Works with any symbol: Forex, Indices, Crypto, Stocks
---
## 🏷️ Tags
`Multi-Timeframe` `Key Levels` `ICT` `Smart Money Concepts` `Sessions` `Previous Day High/Low` `Previous Week High/Low` `Support Resistance` `Institutional Trading` `Order Flow` `Liquidity` `Market Structure`
---
© Inner_Racers
For questions, suggestions, or feedback, please leave a comment below!
**⭐ If you find this indicator helpful, please give it a boost and share with fellow traders!**

Swing High/Low Support ResistanceThis indicator detects recent swing highs and swing lows using Pine Script pivots and marks them with visible chart labels. These points highlight potential turning areas in price action and can help identify short-term support or resistance for intraday or swing trading.
How to Apply
Locate the indicator in TradingView’s “Indicators” library; search by its name or author.
Click the star icon to mark it as a favourite for quick future access.
Apply directly to your chosen chart and timeframe with a single click—no need to enter or paste code.
Adjust the input parameters from the settings panel if desired to personalize swing sensitivity.
Choose Your Timeframe:
Apply to any intraday or swing timeframe; shorter lengths show more frequent pivots.
Set Sensitivity:
Use the “Swing Detection Length” input to adjust how many bars define a pivot, making swings more or less sensitive to price action.
How to Analyze
Swing High Labels: Mark recent local peaks, suggesting resistance zones or possible reversal points.
Swing Low Labels: Highlight recent bottoms, indicating support or bounce areas.
Monitor labels for clustering or repeated appearance at similar levels, which may strengthen their importance as price reacts near those points.
Track how price behaves after forming new pivots—multiple tests can affirm the relevance of a level.
What Traders Should Watch
Price reaction at labeled areas: frequent tests may anticipate reversals or breakouts.
Transition between higher highs/higher lows (uptrend) vs. lower highs/lower lows (downtrend).
Combine the swing levels with other analysis methods, such as volume, RSI, or EMA, for better signal quality.
Features Included
Dynamic swing high and low detection via confirmed pivots.
Direct labeling on the chart for market structure clarity.
No repainting—labels show only after complete formation.
Fully automatic updates as price action unfolds.
No promotional, external, or non-compliant elements; open source and safe for public or private use.
Compliance Notes
No signals, buy/sell calls, financial advice, or performance claims.
No hidden code, advertising, or off-platform contacts.
Pure educational and analytical utility; adheres to all TradingView house rules and script publishing policies.
Disclaimer
This indicator is for informational purposes only and does not constitute advice. Always do your own research and use proper risk management.

MTF Trend Analyzer with Swing Pivots & S/R Levels [SmartFoxy]Indicator “Multi-Timeframe Trend Analyzer with Swing Pivots & S/R Levels”
📌 Overview
Trend & Pivot S/R Levels is a multi-timeframe market structure analyzer that identifies trend direction, detects swing highs/lows, and plots higher-timeframe support/resistance levels directly on your chart.
Designed for traders who want fast, clean, and accurate trend context without constantly switching timeframes.
________________________________________________________________________________
✨ Core Features
1. Multi-Timeframe Trend Analyzer .
Analyze up to five higher timeframes simultaneously — for example:
5m, 1H, 4H, 1D, 1W , etc.
For each timeframe, the indicator detects:
a) Trend direction:
🡕 Uptrend;
🡖 Downtrend.
b) Breakouts of recent pivot highs/lows to determine trend shifts.
c) Automatic graying-out of timeframes lower than the current chart TF .
d) A clean visual Trend Panel that shows:
Arrow direction;
Timeframe label (1D, 1W, etc.);
Trend color (bullish, bearish, neutral).
________________________________________________________________________________
2. Swing Pivot Detection (Current TF)
The script detects local swing points using customizable lookback parameters:
a) Pivot Type:
High/Low — classic swing structure;
Close — smoother swing detection using closing prices.
b) Left/Right Bars Lookback — the number of bars required on both sides to validate the pivot.
c) Multiple marker styles :
Built-in plot shapes (circle, cross, histogram, etc.);
Custom visual labels (▲▼, ◉, ✖, 🡇🡅, ◆, ◼, etc.).
This makes it easy to visually confirm that your swing settings are correct.
________________________________________________________________________________
3. Higher-Timeframe Support/Resistance
The indicator automatically draws HTF S/R lines based on the latest pivot highs/lows from each selected timeframe.
Each timeframe has:
Separate Support / Resistance colors ;
Adjustable line width ;
Selectable line style (solid, dashed, dotted, arrows);
Optional HTF labels displayed on the lines.
This allows you to see major market structure levels from higher timeframes without switching charts.
________________________________________________________________________________
4. Smart Timeframe Safety Checks
If a selected timeframe is lower than your current chart timeframe , its data is:
Disabled for S/R plotting ;
Shown in gray inside the Trend Panel;
Prevents invalid S/R calculations and ensures stable chart performance.
________________________________________________________________________________
⚙️ Customization Options :
Show/Hide the Trend Panel;
Panel placement anywhere on the chart;
Swing pivot type: High/Low or Close ;
Pivot lookback (left/right bars);
Choose five HTFs to analyze;
Enable/Disable HTF S/R;
Configure S/R color for each timeframe;
Line style + line width;
Pivot marker type + size;
Custom label styles + text scaling.
________________________________________________________________________________
✅ Benefits :
Perfect for traders who need instant multi-timeframe structure awareness ;
Reduces the need to constantly switch charts;
Works on all markets : crypto, stocks, forex, indices, futures;
Clean, modern, and intuitive visualization;
Helps confirm trend direction and key S/R levels at a glance.
________________________________________________________________________________
⚠️ Note
The indicator only displays S/R and trend data from higher timeframes relative to the current chart timeframe.
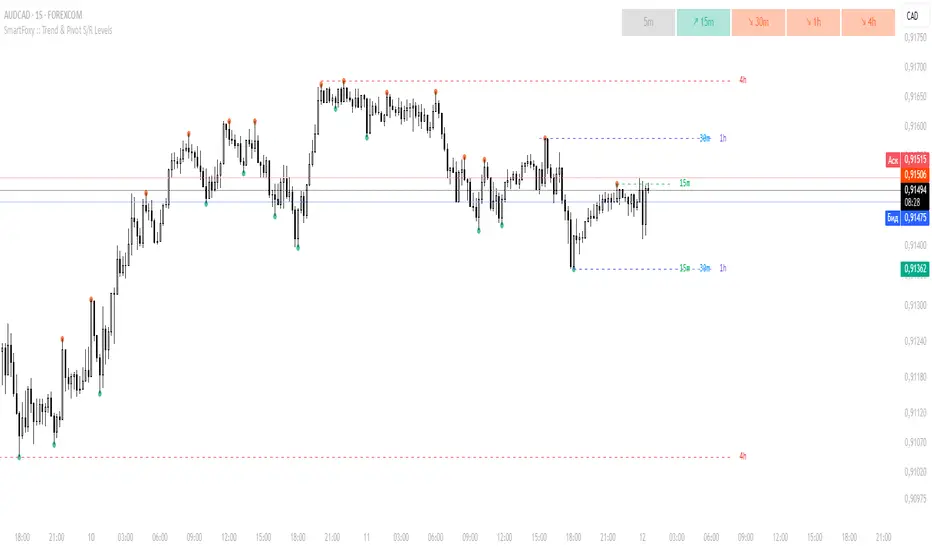
VWAP CATS background flipped 4.0VWAP CATS Background Flipped 4.0 is a sophisticated Pine Script v5 indicator for TradingView that combines a configurable moving average (MA) with dynamic Gann Square of 9 levels to create a multi-layered background shading system for price action analysis. It visualizes support/resistance zones around a central MA (often VWAP or RVWAP) using incremental offsets (either % or absolute points), generating symmetrical bands that resemble a "CATS" (Concentric Adaptive Tiered System) — hence the name.The background is "flipped" in the sense that shading intensity and structure emphasize higher-tier zones, and labels are placed to the right of the chart for future projection.Key FeaturesFeature
Description
Multi-MA Engine
Supports 20+ MA types: EMA, DEMA, TEMA, SMA, VWAP, RVWAP, HMA, ALMA, custom volume blends (CVB1–4)
RVWAP Mode
Rolling VWAP with adaptive or fixed time window (days/hours/minutes)
Gann Square of 9 Logic
Generates 80+ symmetric levels (0.25x to 17x increment) above/below the MA
Dual Increment Mode
Choose Percent or Points for spacing
Background Fills
Tiered transparency fills between Gann levels (darker = stronger zones)
Visual MA Offset
Shift MA line left/right without breaking fill alignment
Smart Labels
Projected labels on last bar: "FV", "normal", "high", "3/4" at key levels
Performance Optimized
Hidden plots + label cleanup to prevent lag
Primary Use Cases
1. Institutional VWAP Anchoring
Use RVWAP (1-day fixed) as maRaw
Set Increment = 0.5 points or 0.05%
Watch price interaction with "normal" (2x), "high" (4x), "3/4" (6x) zones
Ideal for intraday scalping on indices (ES, NQ) or forex
2. Swing Trading with Gann Projections
Use 400-period SMA/EMA on daily chart
Increment in Percent mode (~1.22%)
Identify confluence when price rejects at 2x, 4x, or 6x bands
Labels project future targets to the right
3. Volume-Weighted Mean Reversion
Select CVB1–CVB4 for heavy volume smoothing
Use Points mode for stocks with stable tick sizes (e.g. $0.50 increments)
Trade mean reversion between ±1x and ±2x bands
4. Risk Management & Stop Placement
Place stops beyond 2x or 4x bands
Take profits at next major tier (e.g. 4x → 6x)
Pro Tips
Enable "Use Fixed Time Period" for RVWAP to avoid session reset issues
Increase i_label_offset on lower timeframes to avoid overlap
Combine with volume profile or order flow for confluence
The "FV" label marks the Fair Value MA — core anchor
Summary"VWAP CATS Background Flipped 4.0" turns any moving average into a dynamic Gann-based pricing grid with intelligent background shading and forward-projected labels — perfect for institutional-style mean reversion, swing targeting, and risk-defined trading."

Buy/Sell Volume Tracker [wjdtks255]Indicator Description
Function: Separates buy and sell volume based on candle direction (close ≥ open) and displays the buy−sell difference (hist_val) as a histogram.
Visuals: Buy/sell bars are distinguished by user-selectable colors and opacity; two moving averages (MA1 and MA2) are shown to smooth the flow.
Meaning: A positive histogram indicates buy dominance; a negative histogram indicates sell dominance.
Limitation: The current separation is estimated from candle direction and may differ from execution-side (tick/trade-side) based data.
Trading Rules (Summary)
Conservative trend-following long
Entry: Enter long when hist_val turns above 0 and MA1 crosses MA2 from below.
Stop-loss: Exit if hist_val falls back below 0 or MA1 drops below MA2.
Take-profit: Use a risk:reward of 1:1.5 or set targets based on ATR.
Short-term rebound long
Entry: Enter a short-term long when a large negative histogram region begins to narrow and shows a recovery sign.
Stop-loss: Exit if hist_val drops below the previous low or bearish candles continue.
Take-profit: Prefer quick partial profit-taking.
Short (sell) strategy
Entry: Enter short when hist_val falls below 0 and MA1 crosses MA2 from above.
Stop-loss / Take-profit: Apply the inverse rules of the long strategy.
Filters and risk management
Volume filter: Only accept signals when volume exceeds a fraction of average volume to reduce noise.
Entry strength: Require |hist_val| to exceed a historical average threshold (e.g., avg(|hist_val|, N) × factor) to strengthen signals.
Position sizing: Size positions so that account risk per trade is within limits (e.g., 1–2% of account equity).
Timeframe: Use short timeframes for scalping and 1h+ for swing trading.
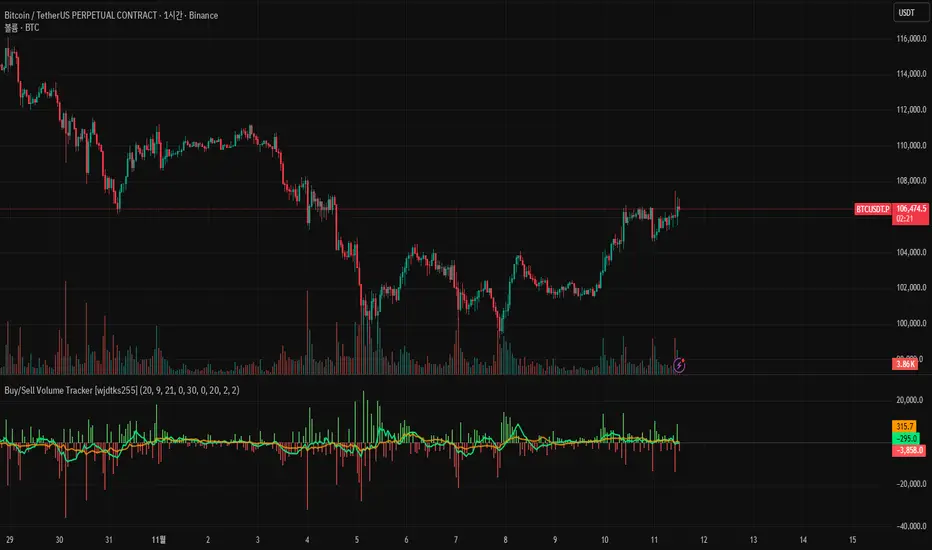
Choch Pattern Levels WITH ALERTS [credit to: @BigBeluga]🔵 OVERVIEW
The Choch Pattern Levels WITH ALERTS indicator automatically detects Change of Character (CHoCH) shifts in market structure — crucial moments that often signal early trend reversals or major directional transitions. It plots the structural break level, visualizes the pattern zone with triangle overlays, and tracks delta volume to help traders assess the strength behind each move. Now, an additional feature of alerts have been included!
🔵 CONCEPTS
CHoCH Pattern: A bullish CHoCH forms when price breaks a previous swing high after a swing low, while a bearish CHoCH appears when price breaks a swing low after a prior swing high.
snapshot
Break Level Mapping: The indicator identifies the highest or lowest point between the pivot and the breakout, marking it with a clean horizontal level where price often reacts.
snapshot
Delta Volume Tracking: Net bullish or bearish volume is accumulated between the pivot and the breakout, revealing the momentum and conviction behind each CHoCH.
snapshot
Chart Clean-Up: If price later closes through the CHoCH level, the zone is automatically removed to maintain clarity and focus on active setups only.
🔵 FEATURES
Automatic CHoCH pattern detection using pivot-based logic.
Triangle shapes show structure break: pivot → breakout → internal high/low.
snapshot
snapshot
Horizontal level marks the structural zone with a ◯ symbol.
snapshot
Optional delta volume label with directional sign (+/−).
Green visuals for bullish CHoCHs, red for bearish.
Fully auto-cleaning invalidated levels to reduce clutter.
Clean organization of all lines, labels, and overlays.
User-defined Length input to adjust pivot sensitivity.
snapshot
NEW! - alert system inserted to Pinescript for either: any triangle forms or whether a bullish "green" triangle or bearish "red" triangle forms - providing real-time alerts for whenever timeframe chart you've selected while creating the alert.
🔵 HOW TO USE
Use CHoCH levels as early trend reversal zones or confirmation signals.
Treat bullish CHoCHs as support zones, bearish CHoCHs as resistance.
Look for high delta volume to validate the strength behind each CHoCH.
Combine with other BigBeluga tools like supply/demand, FVGs, or liquidity maps for confluence.
Adjust pivot Length based on your strategy — shorter for intraday, longer for swing trading.
🔵 CONCLUSION
Choch Pattern Levels WITH ALERTS highlights key structural breaks that can mark the start of new trends. By combining precise break detection with volume analytics and automatic cleanup, it provides actionable insights into the true intent behind price moves — giving traders a clean edge in spotting early reversals and key reaction zones with real-time alerts for precision to evaluate and enter markets.

Rage of UltronRage of Ultron - Multi-Timeframe Smart Money Trading System
Advanced Confluence-Based Trading Indicator
Rage of Ultron is a comprehensive multi-timeframe trading system that combines Smart Money Concepts (SMC) with macro market context, RSI divergences, liquidity sweeps, and volume analysis to identify high-probability setups across all markets.
Key Features
Multi-Timeframe Alignment
* Weekly Bias - Directional trend context
* Daily Structure - Order Blocks and Fair Value Gaps
* 4H Confirmation - Entry timing and execution
* Real-time MTF alignment scoring (🟢 Bull Aligned / 🔴 Bear Aligned / 🟡 Mixed)
Smart Money Concepts
* Order Blocks (OB) - Institutional entry zones with visual clarity
* Fair Value Gaps (FVG) - Price imbalances and retracement magnets
* Change of Character (CHoCH) - Market structure breaks (▲▼)
* Liquidity Sweeps - Stop hunt detection before reversals (💧)
Technical Analysis
* RSI Divergences - Regular and hidden divergences with zones (◆)
* RSI Swing Failure Patterns - Grade-A reversal setups (★)
* Automatic Fibonacci - Dynamic retracements and extensions
* Volume Impulse Detection - Weighted confirmation signals
Macro Market Radar
* DXY - Dollar strength assessment
* BTC Dominance - Crypto market risk gauge
* USDT Dominance - Stablecoin flow analysis
* Combined risk environment scoring
Confluence Scoring System (0-7)
Quantified setup quality with three alert tiers:
* Tier 1 (Score 6-7): Full confluence + sweep + volume + MTF alignment
* Tier 2 (Score 5): High confluence + volume or sweep
* Tier 3 (Score 4): Standard confluence setups
"Rage" Volume State
* 🟢 RAGE PULSE - Explosive volume spike (score 6+ trigger)
* ⚡ Active - Strong volume with good confluence
* 🟡 Stable - Moderate volume conditions
* 🔴 Dormant - Low volume, wait for confirmation
Visual Design
* Clean Zone Rendering - Persistent OB/FVG boxes with limited extension
* Signal Bar Highlighting - Colored fills and contrasting borders for instant recognition
* Dynamic Symbol Placement - ATR-based offset prevents overlap
* Comprehensive Panel - Real-time macro + trade metrics in one view
* Toggleable Legend - Learn signals, hide once familiar
How to Use
1. Set Your Timeframes - Default 1W/1D/4H works for swing trading
2. Monitor Macro Environment - Check risk-on/off context
3. Wait for Confluence ≥4 - Let multiple signals align
4. Enter on Tier 1/2 Alerts - Best probability setups
5. Use Fib Extensions for Targets - Systematic profit taking
Customizable Settings
* Multi-timeframe periods
* RSI length and divergence sensitivity
* Liquidity sweep parameters
* Fibonacci swing lookback
* Volume thresholds
* Shape offset multiplier
* Visual toggles (Fibs, extensions, legend)
Built-in Alert System
Three-tier alert structure lets you filter by setup quality. Set alerts for Tier 1 only for highest conviction trades, or include Tier 2 for more opportunities.
Best Practices
* Use on clean timeframes - 1H+ for less noise
* Combine with support/resistance - Zones near key levels = highest probability
* Respect the macro - Don't fight extreme risk-off environments
* Wait for the full stack - Best trades have 4+ aligned signals
* Practice on demo first - Learn signal behavior in your market
Works On
* Cryptocurrency (spot & futures)
* Forex pairs
* Stock indices
* Individual stocks
* Commodities
Note: This indicator identifies potential setups but does not guarantee profits. Always use proper risk management, position sizing, and stops. Past performance does not predict future results.
Created by cdotgnz | For educational purposes

Trend Bars with Counter Table# TradingView Trend Bar Indicator Explained
## Indicator Overview
This is a TradingView indicator designed to identify and count **Trend Bars**. It not only visually marks strong bullish and bearish bars on the chart but also displays a data table in the upper right corner that tracks the distribution of trend bars across different periods, helping traders quickly assess market bias.
## Core Concept: What is a Trend Bar?
The indicator defines two types of trend bars:
### Bull Trend Bar
- **Condition**: Close > Open (bullish candle)
- **Strength Requirement**: Body size ≥ 75% of total candle range
```
Body Length = |Close - Open|
Total Candle Range = High - Low
Criteria: Body Length ≥ 0.75 × Total Candle Range
```
This means both upper and lower wicks are very short, representing a very strong bullish candle.
### Bear Trend Bar
- **Condition**: Close < Open (bearish candle)
- **Strength Requirement**: Body size ≥ 75% of total candle range
Similarly, this represents a strong bearish candle with minimal wicks and a full body.
## Visual Markers
The indicator marks qualifying candles with:
- **Green upward arrow**: Bull trend bar, appears below the candle
- **Red downward arrow**: Bear trend bar, appears above the candle
## Statistical Function
The indicator uses a **rolling array** (storing up to 1000 trend bars) to track historical data, then counts trend bar distribution across 5 different periods:
| Period | Statistical Range |
|--------|------------------|
| Group 1 | Last 7 trend bars |
| Group 2 | Last 15 trend bars |
| Group 3 | Last 21 trend bars |
| Group 4 | Last 29 trend bars |
| Group 5 | Last 35 trend bars |
**Note**: This counts "the last N trend bars," not "the last N candles." Only candles meeting the trend bar criteria are included.
## Data Table Interpretation
The table in the upper right corner contains 5 columns:
1. **Last N**: The set statistical range (7, 15, 21, 29, 35)
2. **Total**: Actual number of trend bars counted (may be less than target initially)
3. **Bull**: Number of bull trend bars (displayed in green)
4. **Bear**: Number of bear trend bars (displayed in red)
5. **Bias**: Market bias
- "bull" (green): More bull trend bars
- "bear" (red): More bear trend bars
## Practical Applications
### 1. Assess Short-term Momentum
Check the distribution of the last 7 trend bars. If bull trend bars dominate (e.g., 5:2), it indicates strong short-term buying pressure.
### 2. Identify Trend Strength
If multiple periods show the same Bias direction, the trend is very clear. For example, all 5 periods showing "bull" is a strong upward signal.
### 3. Spot Trend Reversals
When short-term bias (7 bars) opposes long-term bias (35 bars), it may signal a trend change in progress.
### 4. Combine with Other Indicators
Use this indicator alongside moving averages, support/resistance levels, and other tools to improve trading decision accuracy.
## Technical Highlights
- **Dynamic Array Management**: Uses `array.unshift()` to add new data at the array's beginning, ensuring the latest trend bars are always first
- **Efficient Statistics**: Quickly calculates bull/bear distribution through loop iteration over specified array ranges
- **Adaptive Display**: Shows actual available count when historical data is insufficient
- **Real-time Updates**: Only updates the table on the last bar to avoid unnecessary calculations
## Conclusion
The core value of this indicator lies in **quantifying price action**. By identifying strong candles with full bodies and clear direction, then tracking their distribution, traders can quickly grasp the balance of market forces and make more informed trading decisions. Whether for intraday trading or swing trading, this tool provides valuable reference information.

Quantum Trend Guardian MTF📊 Descripción de Indicador: “Momentum Clarity”
Resumen:
Momentum Clarity es un indicador diseñado para identificar zonas de alta probabilidad de reversión o continuación de tendencia, combinando análisis de volumen, volatilidad y fuerza relativa. Ideal para traders que buscan claridad en momentos de indecisión del mercado.
Características principales:
• 🔍 Detecta divergencias entre precio y momentum.
• 📈 Señala zonas de sobrecompra y sobreventa con mayor precisión que el RSI tradicional.
• 🟢 Incluye alertas visuales para entradas y salidas potenciales.
• 🧠 Compatible con estrategias de scalping, swing y position trading.
Cómo usarlo:
• Utiliza las señales verdes para considerar entradas en largo y las rojas para cortos.
• Confirma con acción del precio y volumen antes de ejecutar.
• Ajusta la sensibilidad según el marco temporal y tu estilo de trading.
Ventajas:
• Reduce el ruido en mercados laterales.
• Mejora la toma de decisiones en zonas de congestión.
• Aumenta la confianza en escenarios de alta volatilidad
Absolutely! Here's the English version of the indicator description:
📊 Indicator Description: “Momentum Clarity”
Overview:
Momentum Clarity is a custom indicator designed to highlight high-probability zones for trend reversals or continuations by combining volume, volatility, and relative strength analysis. It’s ideal for traders seeking clarity during market indecision.
Key Features:
• 🔍 Detects divergences between price and momentum.
• 📈 Identifies overbought and oversold zones with greater precision than traditional RSI.
• 🟢 Includes visual alerts for potential entry and exit points.
• 🧠 Compatible with scalping, swing trading, and long-term strategies.
How to Use:
• Use green signals to consider long entries and red signals for short positions.
• Confirm with price action and volume before executing trades.
• Adjust sensitivity based on your timeframe and trading style.
Benefits:
• Reduces noise in sideways markets.
• Enhances decision-making in consolidation zones.
• Builds confidence in volatile environments.
If you’d like, I can tailor this description to match your specific indicator’s logic, name, and purpose. Just share a few details and I’ll refine it for publication.
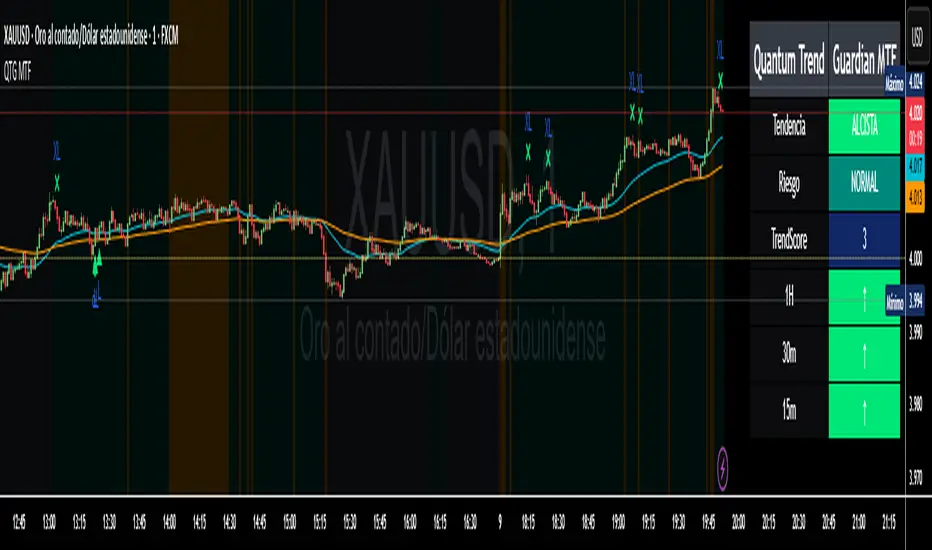
ZOBAKAFXAI – Price Action Swing SetupThe ZOBAKAFXAI Price Action Swing Setup is a swing trading indicator that helps traders identify clear market structure, trend direction, and potential entry/exit zones using EMA and pivot-based price action.
🔹 Features:
✅ Automatically detects swing highs & swing lows (market structure)
✅ EMA-based trend direction filter (EMA50 / EMA200)
✅ Higher timeframe trend filter option (4H bias on lower TFs)
✅ ATR-based Stop Loss & TP calculation
✅ TP1 / TP2 / TP3 based on Risk-to-Reward ratio
✅ Works on all pairs – Forex, Gold, Crypto, Indices
✅ Clean design – ideal for 4H swing trading
🔹 How to Use:
Trade in the direction of the EMA trend
Buy when price forms a higher low above EMA & breaks previous swing high
Sell when price forms a lower high below EMA & breaks previous swing low
Stop Loss = ATR × selected multiplier
TP levels are auto-calculated based on Risk/Reward (2R, 3R, etc.)
⚠ Disclaimer:
This script is for educational and technical analysis purposes only. It is not financial advice. Always use risk management.
